Math 121 summer midterm - Study guides, Class notes & Summaries
Looking for the best study guides, study notes and summaries about Math 121 summer midterm? On this page you'll find 24 study documents about Math 121 summer midterm.
Page 2 out of 24 results
Sort by
-
MATH 225N Week 3 Central Tendancy Question and Answers,WELL EXPLAINED.
- Exam (elaborations) • 30 pages • 2021
- $30.49
- + learn more
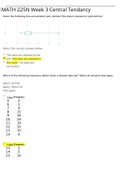
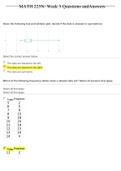
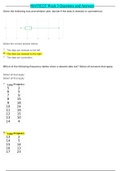
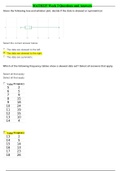
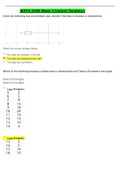
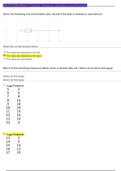
Given the following box-and-whisker plot, decide if the data is skewed or symmetrical. Which of the following frequency tables show a skewed data set? Select all answers that apply. Which of the following frequency tables show a skewed data set? Select all answers that apply. Which of the following frequency tables shows a skewed data set? Select all answers that apply. For the following dataset, you are interested to determine the “spread” of the data……Would you employ calculations ...
-
MATH 225N Week 3 Assignment: Understanding Measures of Central Tendancy_Rated A+
- Exam (elaborations) • 26 pages • 2021
- $21.49
- + learn more
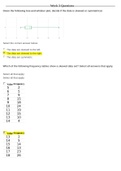
MATH 225N Week 3 Assignment: Understanding Measures of Central Tendancy Question: Given the following box-and-whisker plot, decide if the data is skewed or symmetrical.……… Select the correct an swer below: Question: Which of the following frequency tables show a skewed data set? Select all answers that apply.……… Select the correct answer below: Question: Which of the following frequency tables show a skewed data set? Select all answers that apply. Question: Which of the following fre...
-
MATH 225N Week 3 Central Tendancy Question and Answers: 2019(GRADED A)/(Download To Score An A)
- Exam (elaborations) • 27 pages • 2021
- $10.99
- + learn more
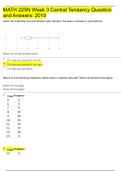
Given the following box-and-whisker plot, decide if the data is skewed or symmetrical. Which of the following frequency tables show a skewed data set? Select all answers that apply. Which of the fol lowing frequency tables show a skewed data set? Select all answers that apply. Which of the following frequency tables shows a skewed data set? Select all answers that apply. For the following dataset, you are interested to determine the “spread” of the data……Would you employ calculations for...

-
MATH 225N Week 3 Assignment; Understanding Measures of Central Tendancy
- Other • 27 pages • 2021
- $21.38
- + learn more
1. Question: Given the following box-and-whisker plot, decide if the data is skewed or symmetrical. Select the correct answer below: 2. Question: Which of the following frequency tables show a skewed data set? Select all answers that apply. Select the correct answer below: 3. Question: Which of the following frequency tables show a skewed data set? Select all answers that apply. 4. Question: Which of the following frequency tables shows a skewed data set? Select all answers that apply. 5. Questi...
-
MATH 225N Week 3 Central Tendancy Questions and Answers (COMPLETE)
- Exam (elaborations) • 26 pages • 2021
- $14.29
- + learn more
1. Given the following box-and-whisker plot, decide if the data is skewed or symmetrical. 2. Which of the following frequency tables show a skewed data set? Select all answers that apply. 3. Which of the following frequency tables show a skewed data set? Select all answers that apply. 4. Which of the following frequency tables shows a skewed data set? Select all answers that apply. 5.For the following dataset, you are interested to determine the “spread” of the data……Would yo...

Get paid weekly? You can!

-
MATH 225N WEEK 3 CENTRAL TENDANCY QUESTIONS AND ANSWERS / MATH225N WEEK 3 CENTRAL TENDANCY QUESTIONS AND ANSWERS (LATEST) : CHAMBERLAIN COLLEGE OF NURSING MATH 225N WEEK 3 CENTRAL TENDANCY QUESTIONS AND ANSWERS
- Exam (elaborations) • 27 pages • 2021
- $15.49
- + learn more
MATH 225N WEEK 3 CENTRAL TENDANCY QUESTIONS AND ANSWERS / MATH225N WEEK 3 CENTRAL TENDANCY QUESTIONS AND ANSWERS (LATEST) : CHAMBERLAIN COLLEGE OF NURSING MATH 225N WEEK 3 CENTRAL TENDANCY QUESTIONS AND ANSWERS Given the following box-and-whisker plot, decide if the data is skewed or symmetrical. Select the correct answer below: ________________________________________ The data are skewed to the left. The data are skewed to the right. The data are symmetric. Which of the following frequenc...
-
MATH 225N Week 3 Quiz / MATH225 Week 3 assignment: Central Tendency Q & A (Latest, 2020): Chamberlain College of Nursing | 100 % VERIFIED ANSWERS, GRADE A
- Exam (elaborations) • 26 pages • 2020
- $20.49
- + learn more
MATH225 Week 3 Quiz / MATH 225 Week 3 Quiz (Central Tendency Q & A) (Latest): Statistical reasoning for health sciences: Chamberlain College of Nursing MATH225N Week 3 Quiz / MATH 225N Week 3 Quiz (Central Tendency Q & A) (Latest): Statistical reasoning for health sciences: Chamberlain College of Nursing Given the following box-and-whisker plot, decide if the data is skewed or symmetrical. Select the correct answer below: ________________________________________ The data are skewed to the l...
-
MATH 225N Week 3 Quiz / MATH225N Week 3 Quiz : Central Tendency Q & A (Latest, 2020): Chamberlain College of Nursing (50 Detail and Verified Answers, Already Graded A)
- Exam (elaborations) • 26 pages • 2020
- $15.49
- + learn more
MATH225 Week 3 Quiz / MATH 225 Week 3 Quiz (Latest): Statistical reasoning for health sciences: Chamberlain College of Nursing MATH225N Week 3 Quiz / MATH 225N Week 3 Quiz (Central Tendency Q & A) (Latest): Statistical reasoning for health sciences: Chamberlain College of Nursing Given the following box-and-whisker plot, decide if the data is skewed or symmetrical. Select the correct answer below: ________________________________________ The data are skewed to the left. The data are skewed...
-
MATH 225N Week 3 Central Tendancy-ALL the Questions And Answers(2020).
- Exam (elaborations) • 28 pages • 2021
- $15.49
- + learn more
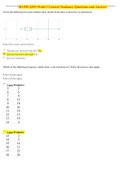
Given the following box-and-whisker plot, decide if the data is skewed or symmetrical. 2. Which of the following frequency tables show a skewed data set? Select all answers that apply. 3. Which of the following frequency tables show a skewed data set? Select all answers that apply. 4. Which of the following frequency tables shows a skewed data set? Select all answers that apply. 5.For the following dataset, you are interested to determine the “spread” of the data……Would you e...
-
MATH 225N WEEK 3 CENTRAL TENDENCY QUESTIONS AND ANSWERS
- Exam (elaborations) • 26 pages • 2021
- $15.49
- + learn more
MATH 225N Week 3 Central Tendency Questions and Answers Given the following box-and-whisker plot, decide if the data is skewed or symmetrical. Which of the following frequency tables show a skewed data set? Select all answers that apply. Which of the following frequency tables show a skewed data set? Select all answers that apply. For the following dataset, you are interested to determine the “spread” of the data……Would you employ calculations for the sample standard deviation, or ...
