N confidence intervals - Study guides, Class notes & Summaries
Looking for the best study guides, study notes and summaries about N confidence intervals? On this page you'll find 473 study documents about N confidence intervals.
Page 4 out of 473 results
Sort by
-
ISYE 6414 Midterm Prep Questions and Answers Graded A+
- Exam (elaborations) • 13 pages • 2023
- $9.99
- + learn more
ISYE 6414 Midterm Prep Questions and Answers Graded A+ We can assess the constant variance assumption in linear regression by plotting the residuals vs. fitted values. True If one confidence interval in the pairwise comparison in ANOVA includes zero, we conclude that the two corresponding means are plausibly equal. True The assumption of normality is not required in linear regression to make inference on the regression coefficients. False (Explanation: is required) We cannot estimate a multi...
-
UCF QMB 3200 - EXAM 3 CONCEPTS QUESTIONS AND ANSWERS 2024.
- Exam (elaborations) • 12 pages • 2024
- $15.99
- + learn more
residual The difference between the observed value of the dependent variable and the value predicted using the estimated regression equation is called a(n) increase the value of the correlation. Influential observations always: normal probability plot. A graph of the standardized residuals plotted against values of the normal scores that helps to determine whether the assumption that the error term has a normal probability distribution appears to be valid is called a: lin...
-
BESC 3010 CH7 TEST WITH CORRECT ANSWERS
- Exam (elaborations) • 3 pages • 2024
- $11.99
- + learn more
BESC 3010 CH7 TEST WITH CORRECT ANSWERS How is the point estimate affected when the sample standard deviation increases? - Answer-It does not change Imagine that samples - Sample A with n = 20 and Sample B with n = 200 - are drawn from the same population and confidence intervals are computed for the same variables, which sample will likely have the more accurate confidence interval? - Answer-Sample B How is a confidence interval affected when the sample standard deviation decreases? - An...
-
Engineering Pathfinder - Engineering Statistics III Questions And Answers Rated A+ New Update Assured Satisfaction
- Exam (elaborations) • 3 pages • 2024
- $7.99
- + learn more
Which is the Two-Sided Confidence Interval? - Answer-(L < μ < U) with __ % Confidence Which is the Sample Size? - Answer-n The fuel efficiency of a new car is tested, resulting in a 2-side confidence interval of (45.6 mpg ≤ μ ≤ 51.1 mpg) with 95 % Confidence. Which conclusion is correct? - Answer-The car's fuel efficiency is not significantly different than 50 mpg, at a confidence level of 95% A new battery is expected to have a storage capacity of 60 ampere-hour (A h). A sampl...

-
MATH302 Week 5 Test
- Exam (elaborations) • 15 pages • 2023
- $35.99
- + learn more
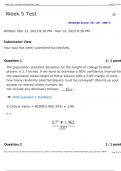
1. Question: The population standard deviation for the height of college football players is 2.7 inches. If we want to estimate a 95% confidence interval for the population mean height of these players with a 0.65 margin of error, how many randomly selected players must be surveyed? 2. Question: The population standard deviation for the height of college basketball players is 2.9 inches. If we want to estimate a 99% confidence interval for the population mean height of these players with a 0.45...

And that's how you make extra money

-
ISYE 6414 - Midterm 1 Prep Questions And Answers Already Graded A+
- Exam (elaborations) • 21 pages • 2023
- $12.49
- + learn more
If λ=1 - we do not transform non-deterministic - Regression analysis is one of the simplest ways we have in statistics to investigate the relationship between two or more variables in a ___ way random - The response variable is a ___ variable, because it varies with changes in the predicting variable, or with other changes in the environment fixed - The predicting variable is a ___ variable. It is set fixed, before the response is measured. simple linear regression - regression analysis i...
-
ISYE 6414 Regression Modules 1-2 (2023/2024) Already Passed
- Exam (elaborations) • 13 pages • 2023
- $9.99
- + learn more
ISYE 6414 Regression Modules 1-2 (2023/2024) Already Passed Assuming that the data are normally distributed, under the simple linear model, the estimated variance has the following sampling distribution: Chi-squared with n-2 degrees of freedom. The fitted values are defined as? The regression line with parameters replaced with the estimated regression coefficients. The estimators fo the linear regression model are derived by? Minimizing the sum of squared differences between the observed and ...
-
UCF QMB 3200 FINAL EXAM WITH 1005 CORRECT ANSWERS
- Exam (elaborations) • 21 pages • 2023
- $14.99
- + learn more
Doubling the size of the sample will reduce the standard error of the mean The sample mean is the point estimator of U Brainpower Read More Previous Play Next Rewind 10 seconds Move forward 10 seconds Unmute 0:13 / 0:15 Full screen A simple random sample of size n from an infinite population of size N is to be selected. Each possible sample should have the same probability of being selected Which of the following statements regarding the sampling distributio...
-
QMB 3200 UCF FINAL VOCAB STUDY QUESTIONS AND ANSWERS
- Exam (elaborations) • 5 pages • 2023
- $11.49
- + learn more
Parameter - A numerical characteristic of a population, such as a population mean µ, a population standard deviation σ, a population proportion p, and so on. Target population - The population for which statistical inferences such as point estimates are made. It is important for the target population to correspond as closely as possible to the sampled population. Sampled population - The population from which the sample is taken. Sampling distribution - A probability distribution cons...
-
MATH302 Week 5 Test APU 20 Q's and A's
- Exam (elaborations) • 15 pages • 2024
- $24.99
- + learn more
1. Question: The population standard deviation for the height of college football players is 2.7 inches. If we want to estimate a 95% confidence interval for the population mean height of these players with a 0.65 margin of error, how many randomly selected players must be surveyed? 2. Question: The population standard deviation for the height of college basketball players is 2.9 inches. If we want to estimate a 99% confidence interval for the population mean height of these players with a 0.45...
