International trade and development economics (E_EBE2_ITDE)
Resume
Summary International Trade and Development Economics
37 vues 2 fois vendu
Cours
International trade and development economics (E_EBE2_ITDE)
Établissement
Vrije Universiteit Amsterdam (VU)
Book
The Economics of Developing and Emerging Markets
Summary for International Trade and Development Economics, everything needed for the final exam is in this document, notes and information from the lectures and information from the textbook.
International trade and development economics (E_EBE2_ITDE)
Tous les documents sur ce sujet (4)
Vendeur
S'abonner
sietsevandam
Aperçu du contenu
Summary – International Trade and Development Economics
Chapter 1 – Economic Development Today
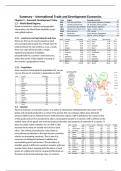
1.2 – World Bank Regions
Based on historical, cultural and geographic
information, the World Bank identifies seven
main global regions.
1.3.1 – Land Area and Agricultural Land Area
These are the top 10 country based on land
area and agricultural land area. People tend to
underestimate the size of Africa, so as a result,
there are maps which provide a simple
equilateral projection of bubbles
proportionally to a country’s total land area,
where the center of the bubble is located at
the country’s geographical center.
1.3.2 – Population
Asian countries dominated the population list, as you
can see the top 15 countries in population in 2019.
1.4 – Income
The best indicator of economic power of a nation is obtained by estimating the total value of the
goods and serviced produced in a certain time period. We can compare either gross domestic
product (GDP) or gross national income (GNI) between nations. GDP is defined as the market value
of the goods and services produced by labor and property located in a country. GNI is defined as the
market value of the goods and serviced produced by labor and property of nationals of a country. It
does not really matter whether we use GDP or GNI
because those value are usually very close to each
other. The ranking of production value tends to
overestimate production in the high-income countries
relative to developing countries. That is why it is
necessary to distinguish between tradable and
nontradable goods and services. The providers of
tradable goods in different countries compete with one
another fairly direct, implying that the prices of such
goods are related and can be compared effectively on
the basis of observed exchange rates. In contract,
1
,nontradeable goods and services have to be provided locally and do not compare with international
providers. To correct for these price differences, the UN Internional Comparison Profect (ICP) collect
data on the priced of goods and services and calculates “purchasing power parity” (PPP) exchange
rates, which better reflect the value of goods. The GNI PPP mostly benefits lower and middle-income
countries.
1.5 – Income per Capita
For an individual inhabitant of a country, the total
production value of a country is hardly relevant. More
important is the production value per capita. Income per
capita gives an idea of the well-being for the average
person in the country but gives no information about the
distribution of the income level within the country.
1.6 – International Trade
An important component of economic development
consists of international interaction trough trade flows.
1.7 – Global Competitiveness
The framework from the World Economic Forum distinguishes 12 pillars
of competitiveness, subdivided under four main headings. This approach
acknowledges that many different aspects are important for determining
a country’s competitiveness and economic growth. The competitiveness
report scores all 12 pillars on a scale from 0 to 100 and calculates the
overall competitiveness score based on that for 141 countries.
Chapter 2 – Data and Models
2.2 – Data Sources
To analyse anything, it is crucial to gather reliable data. We
need to avoid the garbage in, garbage out problem, by
using wrong data as input.
2.3 – Statistics
The first step in the analysis after gathering information on
an economic phenomenon is always to characterize
the data using some simple statistics. The mean and
2
, average are always the same for symmetric distribution. If skewness is negative, the distribution is
skewed to the left. If the random variable X is continuous, we do not work with discrete possibilities
of certain outcomes, but rather with a probability density function f (x), that gives the likelihood of a
certain outcome x. Above are three example density functions.
2.6 – Regression
Suppose there is an economic theory which predicts
a linear relationship between the economic
variables y and x, such that y=α + βx , where α and
β are unknown parameters. Since all theories are
simplifications of reality, there is always a range of
other phenomena which might influence the actual
relationships between the variables y and x. There
can be other, more complicated economic forces
not modelled in the theory which could affect the
relationship, there can be forces outside of
economics, which could affect the relationship, there can be errors in measurement. This gives the
following observed relationship:
y i=α + β x i + ε i
Variable ε i denotes the deviation between the structural linear part of an observation and the actual
value of the observation. This deviation should not be too large, so when it is averaged over many
observations, its value should be zero.
2.7 – Hypothesis Testing
A popular measure for the fit of the line is the share of the variance of the variable y explained by
the estimated line, the so-called R2. In general, the higher the R2, the better the fit. Based on the
t-distribution, we can calculate the probability that the true parameter has a particular value, given
the observation on the pairs (xi,yi) available to us and the associated regression line.
Chapter 6 – International Trade
6.1 – Introduction
The association between trade and income is far from perfect,
some countries are rich even though they are relatively closed, the
USA for example. However, the opposite does not occur, there are
no relatively open and poor countries. The observation for the USA
is related to the size of the economy, it is a relatively large country.
6.2 – International Trade Flows
3
Les avantages d'acheter des résumés chez Stuvia:
Qualité garantie par les avis des clients
Les clients de Stuvia ont évalués plus de 700 000 résumés. C'est comme ça que vous savez que vous achetez les meilleurs documents.
L’achat facile et rapide
Vous pouvez payer rapidement avec iDeal, carte de crédit ou Stuvia-crédit pour les résumés. Il n'y a pas d'adhésion nécessaire.
Focus sur l’essentiel
Vos camarades écrivent eux-mêmes les notes d’étude, c’est pourquoi les documents sont toujours fiables et à jour. Cela garantit que vous arrivez rapidement au coeur du matériel.
Foire aux questions
Qu'est-ce que j'obtiens en achetant ce document ?
Vous obtenez un PDF, disponible immédiatement après votre achat. Le document acheté est accessible à tout moment, n'importe où et indéfiniment via votre profil.
Garantie de remboursement : comment ça marche ?
Notre garantie de satisfaction garantit que vous trouverez toujours un document d'étude qui vous convient. Vous remplissez un formulaire et notre équipe du service client s'occupe du reste.
Auprès de qui est-ce que j'achète ce résumé ?
Stuvia est une place de marché. Alors, vous n'achetez donc pas ce document chez nous, mais auprès du vendeur sietsevandam. Stuvia facilite les paiements au vendeur.
Est-ce que j'aurai un abonnement?
Non, vous n'achetez ce résumé que pour 5,99 €. Vous n'êtes lié à rien après votre achat.