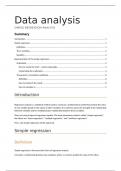
study guide for simple regression analysis
introduction with explanation of what is simple regression analysis
step by step guide on how compute simple regression analysis on excel
Summary
Introduction ................................................................................................................................................. 1
Simple regression.......................................................................................................................................... 1
Definition.................................................................................................................................................. 1
The 2 variables.......................................................................................................................................... 2
Equation.................................................................................................................................................... 2
Representation of the simple regression...................................................................................................... 2
Scatterplot................................................................................................................................................ 2
How to create the chart – step by step guide........................................................................................ 3
Customizing the scatterplot.................................................................................................................. 4
The pearson’s correlation coefficient........................................................................................................ 8
Definition.............................................................................................................................................. 8
How to interpret the result................................................................................................................... 8
How to calculate it................................................................................................................................ 9
Introduction
Regression analysis is a statistical method used to construct a mathematical model that predicts the value
of one variable based on the values of other variables. It is useful to assess the strength of the relationship
between variables and for modeling future relationship between these variables.
There are several types of regression models. The most elementary model is called “simple regression”,
the others are “linear regression”, “multiple regression”, and “nonlinear regression”.
Here, only simple regression will be explained.
Simple regression
Definition
Simple regression is the most basic form of regression analysis.
It involves a relationship between two variables, where 1 is used to predict the value of the other.
, Simple regression can also be called “bivariate linear regression analysis” because it involves only 2
variables and assumes that there is a linear relationship between them.
The 2 variables
Dependent variable: the dependent variable is the one we want to predict/explain. It is
dependent on the independent variable.
o Example: I want to predict the evolution of house prices based on the year. We have 2
variables (house price, year). House prices is the dependent variable.
Independent variable (or predictor, or explanatory variable): the dependent variable is the one
we use to make the prediction about the other variable.
o Example: I want to predict the evolution of house prices based on the year. We have 2
variables (house price, year). Year is the dependent variable.
(Nonlinear relationships and regression models with more than one independent variable can be explored
by using multiple regression models)
Equation
In simple regression analysis, only a straight-line relationship between two variables is examined.
Equation:
y=b0 + b1 x
y: dependent variable
b0: y-intercept of the regression line (i.e., value of the dependent variable when the independent variable
is 0)
b1: slope of the regression line (i.e., change in the dependent variable for a one-unit change in the
independent variable)
x: independent variable
Representation of the simple regression
Scatterplot
A scatter plot is a chart type in excel that is used to show the relationship between two variables. One of
the two variables is placed on the vertical axis, the other on the horizontal axis.
Each value of the variables is plotted as a point on the chart.
Les avantages d'acheter des résumés chez Stuvia:
Qualité garantie par les avis des clients
Les clients de Stuvia ont évalués plus de 700 000 résumés. C'est comme ça que vous savez que vous achetez les meilleurs documents.
L’achat facile et rapide
Vous pouvez payer rapidement avec iDeal, carte de crédit ou Stuvia-crédit pour les résumés. Il n'y a pas d'adhésion nécessaire.
Focus sur l’essentiel
Vos camarades écrivent eux-mêmes les notes d’étude, c’est pourquoi les documents sont toujours fiables et à jour. Cela garantit que vous arrivez rapidement au coeur du matériel.
Foire aux questions
Qu'est-ce que j'obtiens en achetant ce document ?
Vous obtenez un PDF, disponible immédiatement après votre achat. Le document acheté est accessible à tout moment, n'importe où et indéfiniment via votre profil.
Garantie de remboursement : comment ça marche ?
Notre garantie de satisfaction garantit que vous trouverez toujours un document d'étude qui vous convient. Vous remplissez un formulaire et notre équipe du service client s'occupe du reste.
Auprès de qui est-ce que j'achète ce résumé ?
Stuvia est une place de marché. Alors, vous n'achetez donc pas ce document chez nous, mais auprès du vendeur Ca33. Stuvia facilite les paiements au vendeur.
Est-ce que j'aurai un abonnement?
Non, vous n'achetez ce résumé que pour 4,79 €. Vous n'êtes lié à rien après votre achat.