This is a summary of all the lectures of ECR, or my lecture notes. It contains formulas, explanations, definitions, examples, etc. It is very helpful when you cannot yet grasp certain concepts, or when you revise for the exam.
Lecture 1: Correlations and Measures of Effect Size
Correlation (and scatterplots)
• Correlation is not causation. Correlation: is there an association between 2 variables?
Causality: is there an effect?
- Covariance (association)
- Directionality (cause precedes effect)
- Internal validity (eliminate alternative explanations
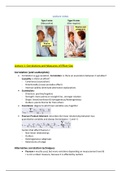
• Scatterplots:
- Direction: positive/negative
- Strength: more points on straight line., stronger relation
- Shape: linear/nonlinear & homogeneous/heterogeneous
- Outliers: points that lie far from others
• Covariance: degree to which two variables vary together
• Pearson Product-Moment: describes the linear relationship between two
quantitative variables and always lies between −1 and +1
Factors that affect Pearson r:
- Non-linear relationships
- Outliers
- Heterogeneous subgroups
- Restrictions of range
Alternative correlation techniques
• Pearson r mostly used, but more variations depending on measurement level &
r is not a robust measure, because it is affected by outliers
, • Spearman’s rho (rs): Describes relationship between two ordinal variables and/or
ranked scores. If scores are not ranked already: convert raw scores into ranks.
Then use Pearson correlation formula to calculate rs. rs = r on ranked data and
• Point-Biserial Correlation (rpb): Describes relationship between quantitative and
dichotomous variable. rpb = r
• Phi Coefficient (φ): Describes relationship between two dichotomous variables.
φ = r.
Relationship φ and χ2:
Testing the significance of r
Discussed correlation techniques used in samples, but what does it say about a population?
(r can be every correlation technique)
Measures of effect size
Statistical significance depends on N, r, and α
• Results:
- Weak correlations in large samples can become significant
- Strong correlations in small samples might not significant
• Conclusion: Testing only for significance is too limited
reffect: r can stand every correlation technique and square r, to prevent hard to interpret
correlation value:
• r2: also called VAF and COD
• Cohen’s d and Hedges’ g: Suitable for comparing the means of two groups (rpb).
Cohen’s d based on population parameters; Hedges’ g on sample statistics
Relation between t and Hedges’ g:
, • Rules of thumb:
Lecture 2: simple linear regression
Regression: enables you to predict one interval variable from one or more others
• 1 predictor = simple
• 2 predictors = multiple
Regression line = the vertical squared deviations between the dots and the regression line is
smallest
Regression equation
• B0 = intercept/constant: predicted value of Y when X = 0
• B1 = slope: size of the difference in Y if X increases by 1 unit
• Ei (error) = observed yi – predicted yi
• Steps:
1. Formulate the regression equation for these data -> calculate b1, b0 and y
(regression line)
2. What is the predicted number of hours of sleep for a mother with a 5-month old
baby? -> fill in x in new formula y
• Interpolation: making a prediction within the range of X and Y
• Extrapolation: making a prediction outside the range of X and Y
• Solution to when unit of measurement changes: standardised regression
Les avantages d'acheter des résumés chez Stuvia:
Qualité garantie par les avis des clients
Les clients de Stuvia ont évalués plus de 700 000 résumés. C'est comme ça que vous savez que vous achetez les meilleurs documents.
L’achat facile et rapide
Vous pouvez payer rapidement avec iDeal, carte de crédit ou Stuvia-crédit pour les résumés. Il n'y a pas d'adhésion nécessaire.
Focus sur l’essentiel
Vos camarades écrivent eux-mêmes les notes d’étude, c’est pourquoi les documents sont toujours fiables et à jour. Cela garantit que vous arrivez rapidement au coeur du matériel.
Foire aux questions
Qu'est-ce que j'obtiens en achetant ce document ?
Vous obtenez un PDF, disponible immédiatement après votre achat. Le document acheté est accessible à tout moment, n'importe où et indéfiniment via votre profil.
Garantie de remboursement : comment ça marche ?
Notre garantie de satisfaction garantit que vous trouverez toujours un document d'étude qui vous convient. Vous remplissez un formulaire et notre équipe du service client s'occupe du reste.
Auprès de qui est-ce que j'achète ce résumé ?
Stuvia est une place de marché. Alors, vous n'achetez donc pas ce document chez nous, mais auprès du vendeur fiorafleur. Stuvia facilite les paiements au vendeur.
Est-ce que j'aurai un abonnement?
Non, vous n'achetez ce résumé que pour 7,99 €. Vous n'êtes lié à rien après votre achat.