Summary Quantitative Methods (MAN-BCU2030EN)
Themes and chapters discussed in this summary are: Linear Regression, Discrete choice models,
Structural Equation Modelling (SEM), Spatial Analysis & Time Series Analysis.
Course completed with a 9.5
Theme 1: Linear Regression
Terms:
- Residual – error – ‘’e’’ in statistics
- b0 = intercept /
constant / not important
- b1 = slope / coefficient / determines whether Y and X have an effect on each other
- Xi1 = independent variable and Yi = dependent variable
Least squares method (OLS)
- about: residuals/ deviances; to model a regression line in which:
- Draw a line in which: Minimize ∑ ei2 (sum of squared errors / residuals minimized – in which the
difference between the observed and predicted is the least)
,- formula for residuals:
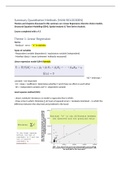
Relevance of the model: R-Squared
- relevance of model as a whole: how much of the
variables in the model explain the whole model. If the
variables explain very little of e.g. the independent or
dependent variable, the model is not relevant. Because
they don’t have much effect on each other (x on y)
- After drawing the line: r-sqaure measures how well the
model fits the observations, the share of the variation of Y
that is explained by the model, the X’s you put in there.
(goodness-of-fit / modelfit)
Formula:
Outliers & multicollinearity
- observations beyond 3 sd of the mean (variance of 3 from the mean) are outliers and can be
removed to be seen in a graph with sd’s
-multicollinearity is a problem, because the correlation between 2 explanatory (independent)
variables is too high. Then you can’t interpret the relevance of the individual explanatory variables
anymore.
- rule of thumb for detection: VIF >10 (or tolerance < 0.1) serious problem multicllinearity. VIF
substantially higher than 1 (or tolerance < 0.2) may be a problem.
,Dummy variables
- to include qualitative variables in your regression
When to use dummies?
Formula dummies (when > 2 categories) = number of dummies = number of categories minus 1 (this
is the reference)
Non-linearity
- when a line is not linear. To make it linear:
1) add regression model quadratic. Same formula of regression but with 2
2) transform with a mathematical function, mostly done with logistic regression. You can do this with
mathematical transformation: ln natural logarithm.
Discrete choice models, definition & types
- Regression models that predict the chance that a person, organisation etc. choses a discrete
alternative (yes/no, dead/alive, go/don’t go) based on his/her/its characteristics (age/ height /
grades)
- the alternatives (dependent) have to meet 3 criteria:
1. The set of alternatives have to be exhaustive (the choice must fall on one of the alternatives)
2. The alternatives have to be exclusive (it is not possible to chose more than one alternative)
3. The set of alternatives may not be too large
Binary choice models (logistic regression)
- calculates the chances (because non-metric variable) that Y = 1 (mostly this is the: yes/pass/ effect
SPSS says which one is which)
- think of example: pass/don’t (alternative) pass exam on basis of your grade for OIM-B last year
(characteristic)
Binary choice model: calculating the odds in 4 steps
1. Model with predicted chance (p): chance is 1 op 6 1/6 = the predicted chance (what is the
chance that students pass QM given their grades in OIM-B? problem = predicted chances are
sometimes above or below 1 and 0 needs to be either 1 or 0 (one of the alternatives) solution to
fix the range is a new algebra model: 2 tricks: odds and log odds
2. Model with odds: chance that something will happen in relation to that it will not happen: p / 1 – p
this algebra model is not enough, because the predicted values go < 0 + the line is not linear, so it
does not meet conditions of linear regression (think of assumption met residuals even). So therefore;
last algebra tricks (making use of the odds, but a new model: log odds (logits):
Formula: (je doet 1-p want 1-1 is 0 (kans dat het gebeurd -1 want dat is de kans dat het niet gebeurd
want dat wordt aangegeven met een 0)
Voordelen van het kopen van samenvattingen bij Stuvia op een rij:
√ Verzekerd van kwaliteit door reviews
Stuvia-klanten hebben meer dan 700.000 samenvattingen beoordeeld. Zo weet je zeker dat je de beste documenten koopt!
Snel en makkelijk kopen
Je betaalt supersnel en eenmalig met iDeal, Bancontact of creditcard voor de samenvatting. Zonder lidmaatschap.
Focus op de essentie
Samenvattingen worden geschreven voor en door anderen. Daarom zijn de samenvattingen altijd betrouwbaar en actueel. Zo kom je snel tot de kern!
Veelgestelde vragen
Wat krijg ik als ik dit document koop?
Je krijgt een PDF, die direct beschikbaar is na je aankoop. Het gekochte document is altijd, overal en oneindig toegankelijk via je profiel.
Tevredenheidsgarantie: hoe werkt dat?
Onze tevredenheidsgarantie zorgt ervoor dat je altijd een studiedocument vindt dat goed bij je past. Je vult een formulier in en onze klantenservice regelt de rest.
Van wie koop ik deze samenvatting?
Stuvia is een marktplaats, je koop dit document dus niet van ons, maar van verkoper HilalsahinRU. Stuvia faciliteert de betaling aan de verkoper.
Zit ik meteen vast aan een abonnement?
Nee, je koopt alleen deze samenvatting voor €9,49. Je zit daarna nergens aan vast.