100% tevredenheidsgarantie Direct beschikbaar na betaling Zowel online als in PDF Je zit nergens aan vast
logo-home
Extensive summary of the book for Risk Management €4,49
In winkelwagen

Samenvatting

Extensive summary of the book for Risk Management

 43 keer bekeken  0 keer verkocht

This is an extensive summary of the book chapters that have to be know for the course Risk Management in . The chapters covered are chapters 6, 15 and 19. The section on univariate modelling and multivariate modelling is not covered by this book and thus not included. The chapter on Basel is prob...

[Meer zien]
Voorbeeld 7 van de 34  pagina's

  • Nee
  • Chapters 6, 15 and 19
  • 22 januari 2023
  • 34
  • 2022/2023
  • Samenvatting
book image

Titel boek:

Auteur(s):

  • Uitgave:
  • ISBN:
  • Druk:
Alles voor dit studieboek (2)
Alle documenten voor dit vak (5)
avatar-seller
morganesauwens
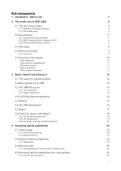
Risk management
1. Introduction - What is risk 3

2. The credit crisis of 2007-2008 4
2.1.The US housing market 4
2.1.1.Relaxation of lending standards 4
2.1.2.The bubble burst 4

2.2.Securitisation 5
2.2.1.Asset-backed Securities (ABS) 5
2.2.2.ABS Collaterised Debt Obligation (CDO) 6
2.2.3.CDOs and ABS CDOs in practice 6

2.3.The losses 8
2.4.What went wrong? 9
2.4.1.Incentives 9

2.5.Summary of the chapter 10
What happened... 10
What were the consequences? 11
Why was it so bad? 11
Role of Incentives 11
What changed afterwards 11

3. Basel I, Basel II and Solvency II 12
3.1.The reason for regulating banks 12
3.2.Bank regulation pre-1988 12
3.3.The 1988 BIS accord 13
3.3.1.The Cooke Ratio 13
3.3.2.Capital requirement 14

3.4.G-30 Policy Recommendations 15
3.5.Netting 15
3.6.The 1996 Amendment 16
3.7.Basel II 17
3.8.Credit risk capital under Basel II 18
3.8.1.The Standardised approach 18
3.8.2.The IRB Approach 19
3.8.3.Corporate, sovereign and bank exposures 22

4. Estimating default probabilities 23
4.1.Credit ratings 23
4.1.1.Internal Credit Ratings 23
4.1.2.Altman’s Z-Score 23

4.2.Historical default probabilities 24
4.2.1.Hazard rates 24

4.3.Recovery rates 25
4.3.1.The dependence of recovery rates on default rates 25

4.4.Estimating default probabilities from credit spreads 26
4.4.1.A more exact calculation 26


1

, 4.1.Comparison of default probability estimates 26
4.1.1.Real world vs. Risk-neutral default probabilities 27
4.1.2.Which estimates should be used? 28

4.2.Using equity prices to estimate default probabilities - Merton Model 28
4.2.1.Distance to default 29

4.1.Credit default swaps 30
4.1.1.Credit indices 31

4.2.Credit spreads 31
4.2.1.CDS spreads and bond yields 31
4.2.2.CDS-Bond basis 32
4.2.1.Using CDS prices to predict default probabilities 32
4.2.1.Concerns with the CDS market 32
4.2.1.Negative sovereign spreads 33

6. Examples of exam questions: 36
2022-2023 36
2020-2021 37
Other 38
Other series of questions: 52


2

,1. Introduction - What is risk
Risk drivers ⟹ What can go wrong?
Probabilities ⟹ How likely is it to go wrong?
Impact/loss ⟹ If it does, what is the result?

A risk is characterised through:
- Set of outcomes: these are the impacts of scenarios that may occur during a selected timeframe
(the horizon).
- The probabilities of these outcomes.
Mathematically speaking, a risk is a random variable.

Risk management is an inherent part of running any business:
- Shareholders want a good balance between return (opportunity) and volatility (danger)
- Avoiding bankruptcy or a rating downgrade is of crucial importance for any company and
needs to be dealt with as well.
Note that for the financial industry, it is even more important for the following reason:
- Insolvency may have a big impact on the (global) economy
- Banks are interconnected, which creates systemic risk

The different stakeholders within the
financial world have differing, conflicting
interests.


3

,2. The credit crisis of 2007-2008
2.1.The US housing market
Around 2000, the house prices in the US started to rise much faster than they did in the previous
decade. A major contributing factor to this were the very low level of interest rates between 2002
and 2005. But the bubble in house prices was mainly caused by mortgage lending practices.
Subprime mortgage1 lending increased hugely between 2000 and 2006.

2.1.1. Relaxation of lending standards
Around 2000 mortgage lenders started relaxing their lending standards, making it possible for
many families, that had in the past been deemed not sufficiently credit worthy to qualify for a
mortgage, to purchase houses. This increased the demand for real estate and thus the price.
The combination of rising house prices and more lending was interesting to mortgage brokers
and lenders.
- More lending meant more profits.
- The rising house prices meant that the lending was well covered by the underlying collateral. If
the borrower defaulted the foreclosure would lead to little or no loss.

But the rising price meant that for first-time buyers it became more difficult to afford a house. So
they had to relax the lending standards even more to be able to attract new entrants to the
housing market.
- The amount lent as a percentage of the house price increased
- Adjustable rate mortgages (AMRs) were developed
- Lenders became more cavalier about reviewing mortgage applications

Why was the US government not regulating
the behaviour of mortgage lenders? The US
government had been trying to expand
home ownership since the 90s and had been
pressuring mortgage lenders to increase
loans to low- and moderate-income
households.

2.1.2.The bubble burst
Prices increased very fast during 2000 and
2006 but in the second half of 2006, house
prices started to go down. This happened for
several reasons:
- As house prices increased, demand for
houses declined.
- Some borrowers with teasers rates found
that they could no longer afford their mortgages when the teaser rates ended. This led to
foreclosures and an increase in the supply of houses for sale
- The decline in house prices fed on itself. Individuals who had borrowed 100%, or close to
100%, of the cost of a house found that they had negative equity. Some of these individuals


1 Subprime mortgages are mortgages that are considered significantly more risky than average.
4

, chose to default.This led to more foreclosures, a further increase in the supply of houses for
sale, and a further decline in house prices.
As foreclosures increased, the losses on mortgages also increased. Losses were high because
houses in foreclosure were often surrounded by other houses that were also for sale. They were
sometimes in poor condition. In addition, banks faced legal and other fees. In normal market
conditions, a lender can expect to recover 75% of the amount owed in a foreclosure. In 2008 and
2009, recovery rates as low as 25% were experienced in some areas.


2.2.Securitisation
2.2.1. Asset-backed Securities (ABS)
An asset-backed security (ABS) = a security created from the cash flows of financial assets such as
loans, bonds, credit card receivables, mortgages, auto loans and aircraft leases.

How does it work?
A portfolio of assets (such as subprime
mortgages) is sold by the originators of
the assets to a special purpose vehicle
(SPV) and the cash flows from the assets
are allocated to tranches (the senior
tranche, mezzanine tranche and the
equity tranche). Each tranche has a
principal and a promised return.
The equity tranche is much less likely to
realise its return than the other two
tranches.
Cash flows are allocated
to tranches by specifying
what is know as a
waterfall. There is a
separate waterfall fr the
interest and principal
cash flows.
Interest cash flows from
the assets are allocated to the senior tranche until the senior tranche has received its promised
return on its outstanding principal. Assuming that the promised return to the senior tranche can
be made, cash flows are then allocated to the mezzanine tranche. If the promised return to the
mezzanine tranche can be made, and interest cash flows are left over, they are allocated to the
equity tranche. The same principle applies to principal cash flows.
This structure lasts several years but the extent to which the tranches get their principal back
depends on the losses of the underlying assets. If losses exceed 5%, the equity tranche loses all
its principal and some losses are borne by the principal of the mezzanine tranche. If losses exceed
25%, the mezzanine tranche loses all its principal and some losses are borne by the principal of
the senior tranche.
Summary:
- Cash flows go first to the senior tranche, then mezzannine and then equity tranche.
- Losses of the principal are first borne by the equity tranche, followed by the mezzaninne and
lastly by the senior tranche.

5

,The ABS is designed so that
the senior tranche is rated
AAA, the mezannine tranche
BBB and the equity tranche is
typically unrated.
The objective of the creator
of the ABS is to make the
senior tranche as big as
possible without losing its
AAA credit rating. (This
maximises the profitability of
the structure.) The creator of
the ABS expects to make a
profit because the weighted
average return on the assets in the underlying portfolio is greater than the weighted average
return offered to the tranches.
A particular type of ABS is a collateralised debt obligation (CDO).This is an ABS where the
underlying assets are fixed-income securities.

2.2.2. ABS Collaterised Debt Obligation (CDO)
Finding investors to
buy the senior AAA-
rated tranches
created from
subprime mortgages
was not difficult.
Equity tranches were
typically retained by
the originator of the
mortgages or sold to
a hedge fund.
Finding investors for the mezzanine tranches was more difficult. This led financial engineers to be
creative. Financial engineers created an ABS from the mezzanine tranches of ABSs that were
created from subprime mortgages. This is known as an ABS CDO.
The senior tranche of the ABS CDO is rated AAA. This means that the total of the AAA-rated
instruments created in the example that is considered here is 90% (75% plus 75% of 20%) of the
principal of the underlying mortgage portfolios. This seems high but, if the securitisation were
carried further with an ABS being created from the mezzanine tranches of ABS CDOs (and this did
happen), the percentage would be pushed even higher.
Many banks have lost money investing in the senior tranches of ABS CDOs. The investments
typically promised a return quite a bit higher than the bank’s funding cost. Because they were
rated AAA, the capital requirements were minimal.

2.2.3.CDOs and ABS CDOs in practice
In practice, many more tranches were created, and many of the tranches were thinner (i.e.,
corresponded to a narrower range of losses). Figure 6.5 shows a more realistic example of the
structures that were created. Two ABS CDOs are created:
- One (referred to as a Mezz ABS CDO) is created from the BBB-rated tranches of ABSs;
6

, - the other (referred to as a high-grade ABS CDO) is from the AAA, AA, and A tranches of ABSs.
- The figure shows a third level of securitisation based on the A and AA tranches of the Mezz ABS
CDO.
There was typically a small amount of overcollateralisation with the face value of the mortgages
being greater (by 1% or 2%) than the total face value of the ABS tranches. This created a cushion
for investors, but it is not
difficult to see that investors
in many of the tranches
created would lose principal
in situations where losses on
the underlying subprime
mortgage portfolios were
moderately high.
The risks in the AAA-rated
tranches of ABSs and ABS
CDOs were higher than either
investors or rating agencies
realised. One of the reasons
for this involves correlation.
The values of the tranches of
ABSs depend on the default
correlation of the underlying
mortgages. The tranches of
ABS CDOs are even more
heavily dependent on these
default correlations. If mortgages exhibit a fairly low default correlation (as they do in normal
times), there is very little chance of a high overall default rate and the AAA rated tranches of both
ABSs and ABS CDOs are safe.
But, many analysts overlooked the fact that correlations always increase in stressed market
conditions. In 2005 to 2006, the models used by investors and rating agencies assumed
correlations that were too low for the upheavals in the U.S. housing market that were considered
likely by many observers.

The effect of correlation on CDO tranches:
Assume N exposures, each of which can default with a probability p.
A) What is the probability of the equity tranche being hit, that is of at least one default?
- All exposures are independent
⟹ binomial distribution
P (at least one default) = 1 - P (no defaults) = 1 - (1 - p)N
- All exposures are perfectly correlated (N times the same exposure)
P (at least one default) = 1 - P (no defaults) = 1 - (1-p) = p
⟹ Diversification works against the equity tranche
B) What is the probability of the AAA tranche being hit, that is of all or almost all names going
into default?
- All exposures are independent
⟹ binomial distribution
P(all names default) = pN
- All exposures are perfectly correlated (N times the same exposure)
7

Voordelen van het kopen van samenvattingen bij Stuvia op een rij:

√  	Verzekerd van kwaliteit door reviews

√ Verzekerd van kwaliteit door reviews

Stuvia-klanten hebben meer dan 700.000 samenvattingen beoordeeld. Zo weet je zeker dat je de beste documenten koopt!

Snel en makkelijk kopen

Snel en makkelijk kopen

Je betaalt supersnel en eenmalig met iDeal, Bancontact of creditcard voor de samenvatting. Zonder lidmaatschap.

Focus op de essentie

Focus op de essentie

Samenvattingen worden geschreven voor en door anderen. Daarom zijn de samenvattingen altijd betrouwbaar en actueel. Zo kom je snel tot de kern!

Veelgestelde vragen

Wat krijg ik als ik dit document koop?

Je krijgt een PDF, die direct beschikbaar is na je aankoop. Het gekochte document is altijd, overal en oneindig toegankelijk via je profiel.

Tevredenheidsgarantie: hoe werkt dat?

Onze tevredenheidsgarantie zorgt ervoor dat je altijd een studiedocument vindt dat goed bij je past. Je vult een formulier in en onze klantenservice regelt de rest.

Van wie koop ik deze samenvatting?

Stuvia is een marktplaats, je koop dit document dus niet van ons, maar van verkoper morganesauwens. Stuvia faciliteert de betaling aan de verkoper.

Zit ik meteen vast aan een abonnement?

Nee, je koopt alleen deze samenvatting voor €4,49. Je zit daarna nergens aan vast.

Is Stuvia te vertrouwen?

4,6 sterren op Google & Trustpilot (+1000 reviews)

Afgelopen 30 dagen zijn er 53340 samenvattingen verkocht

Opgericht in 2010, al 14 jaar dé plek om samenvattingen te kopen

Start met verkopen
€4,49
  • (0)
In winkelwagen
Toegevoegd