Tentamen (uitwerkingen)
TextAnalytics_Week3_NEC_solved
- Vak
- Instelling
- Boek
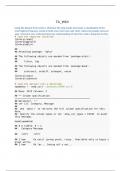
Using the dataset from week 2, eliminate the stop words and create a visualization of the highest frequency words in both a bar chart and a pie chart. Label your graphs and your axes. Comment your code showing your understanding of what the code is doing line by line.
[Meer zien]