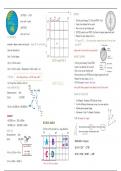
Summary GEOGRAPHY MAP WORK - Calculations, Analysis and More
21 keer bekeken 0 keer verkocht
Vak
Geography
Instelling
12th Grade
Map work skills in just three pages with a practice map too!
Includes answering tips and example questions
Covers: co-ordinates, reference number, distance, bearing, magnetic bearing, magnetic declination, gradient, cross-section, vertical exaggeration and how to read a map
LATITUDE – is “flat” E BEARING
move north & south 1. Find the points bearing TO (End) and FROM (Start)
2. Create a line between the two points
LONGITUDE 3. Draw a cross on your starting point
move east & west 4. CENTER protractor over FROM (Start) and zero degrees aligned with north
CO-ORDINATES 5. Measure the value reading clockwise
*if it passes 180° … flip your protractor, measure from zero to the new point
measured in degrees, minutes and seconds… always SE for South Africa and add 180°
Start with latitude first Always read on the outside of your protractor!
S
Step 1: Find the degree MAGNETIC BEARING
33°15’ S and 25°45’ E
Step 2: Find the minutes 1. Find the points bearing TO and FROM
2. Create a line between the two points
Step 3: Find the seconds = (Measurement x Block Length) ÷ 60 3. Draw a cross on your starting point
4. Centre protractor over FROM and zero degrees aligned with north
DISTANCE When doing distance ….NB the map scale!!! 5. Measure the value reading clockwise
Use “King Henry” method or short cut MAP SKILLS 6. ADD the angle of magnetic declination
KING HENRY METHOD From South Africa, magnetic north always lies west of true north.
MAGNETIC DECLINATION
1. Find Magnetic Declination (MD) and year of map
2. Find the difference between year on map & in exam questions
3. Multiply year by annual change
4. Add answer of step 3 to Magnetic Declination
!!! NB: 60 minutes in 1 degree
REFERENCE NUMBER
SHORT CUT Will find on the map near key + mag declination
2018-2002 = 16 years
16 x 8’ = 128° = 2°08’
16°52 + 2°08’ = 18°60’ …. = 19°
There is an ABC in every degree
, VERTICAL EXAGGERATION
CROSS SECTION is a profile or a side view of a relief feature.
refers to the proportion by which the vertical scale of a cross-section is
1. Draw a line on the map, joining starting point to ending point for EG. A–B increased to allow us to see physical features better
2. Place a rough piece of paper along this line, & mark off each contour line on
the paper, with its corresponding height NB: mark off significant features
3. Draw a set of axis on graph paper. Start the y-axis one interval lower than the
lowest value of the cross-section and end it one value above the highest value.
4. Place the piece of paper onto the X axis and mark off corresponding lines.
5. Join the dots if asked to label features on the cross-section, place an arrow
pointing to their locations, and label the arrow.
6. Name your cross section and label your axis
GRADIENT
1. Find your highest and lowest point
2. (Highest – lowest) = Vertical Diff.
3. Measure horizontal distance and convert
4. Vertical diff ÷ Horizontal Distance
Intervisibility is the ability to see one point
from another point on the landscape
Place B is intervisible from place A. Place C
is not intervisible from Place A. TYPES OF SLOPES
Vertical scale will affect how it looks
, TYPICAL ANALYSIS QUESTIONS:
1. Suggest why farm here OR Identify x reasons using map to farm here.
Flat land/ River/ Climate/ Slope aspect
2. Suggest why x industry s here?
Transport/ Kind of people living nearby/ Minerals or resources available
3. State a reason for sewage/airport here?
MAP ANALYSIS
Disturbance
4. Explain location of small town outside of city?
Apartheid
5. Identify x types of recreation/tourism
6. Identify features labelled M, P, T
These will be using key e.g. Recreation/ Cemetery/ Industry A NOTE ON RIVERS
Rivers do NOT always flow north or up the map!
OTHER TIPS:
MORE TIPS: Some tips for finding flow direction:
Know how to apply microclimate theory to map work
Know your provinces, ocean currents and oceans Rivers always flow into dams… look for the dam wall
- Valley climates/ Radiation fog/ Slope Aspect/ Thermal belt
These are easy marks often asked in Que 1 Rivers flow downhill…contour readings get smaller
Know how to apply rivers theory to map work
The source = start of river… follow the flow
- River stage/ River flow/Fluvial features/ Type of river
Voordelen van het kopen van samenvattingen bij Stuvia op een rij:
√ Verzekerd van kwaliteit door reviews
Stuvia-klanten hebben meer dan 700.000 samenvattingen beoordeeld. Zo weet je zeker dat je de beste documenten koopt!
Snel en makkelijk kopen
Je betaalt supersnel en eenmalig met iDeal, Bancontact of creditcard voor de samenvatting. Zonder lidmaatschap.
Focus op de essentie
Samenvattingen worden geschreven voor en door anderen. Daarom zijn de samenvattingen altijd betrouwbaar en actueel. Zo kom je snel tot de kern!
Veelgestelde vragen
Wat krijg ik als ik dit document koop?
Je krijgt een PDF, die direct beschikbaar is na je aankoop. Het gekochte document is altijd, overal en oneindig toegankelijk via je profiel.
Tevredenheidsgarantie: hoe werkt dat?
Onze tevredenheidsgarantie zorgt ervoor dat je altijd een studiedocument vindt dat goed bij je past. Je vult een formulier in en onze klantenservice regelt de rest.
Van wie koop ik deze samenvatting?
Stuvia is een marktplaats, je koop dit document dus niet van ons, maar van verkoper kirstenms. Stuvia faciliteert de betaling aan de verkoper.
Zit ik meteen vast aan een abonnement?
Nee, je koopt alleen deze samenvatting voor €5,38. Je zit daarna nergens aan vast.