100% tevredenheidsgarantie Direct beschikbaar na betaling Zowel online als in PDF Je zit nergens aan vast
logo-home
Solutions Manual Modeling and Analysis of Dynamic Systems 3rd edition ByRamin S. Esfandiari, Bei Lu €24,37   In winkelwagen

Tentamen (uitwerkingen)

Solutions Manual Modeling and Analysis of Dynamic Systems 3rd edition ByRamin S. Esfandiari, Bei Lu

 8 keer bekeken  0 keer verkocht
  • Vak
  • System admin
  • Instelling
  • System Admin

Solutions, Solutions Manual Modeling and Analysis of Dynamic Systems 3rd edition By Ramin S. Esfandiari, Bei Lu. ISBN. 9781315191294. Edfandiari 3e Modeling and Analysis of Dynamic Systems solutions manual.

Voorbeeld 4 van de 538  pagina's

  • 24 januari 2024
  • 538
  • 2018/2019
  • Tentamen (uitwerkingen)
  • Vragen en antwoorden
  • System admin
  • System admin
avatar-seller
SOLUTION MANUAL

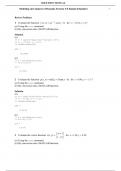
Modeling and Analysis of Dynamic Systems 3/E Ramin Esfandiari 1


Review Problems

=
1 Evaluate the function f ( x, y ) 23 e − x /2 cos( y − 1) for x =
−0.23, y =
2.7
(a) Using the subs command.
(b) By conversion into a MATLAB function.

Solution
(a)
>> f = sym('2*exp(-x/2)*cos(y-1)/3');
>> x = -0.23; y = 2.7;
>> double(subs(f))

ans =

-0.0964

(b)
>> F = matlabFunction(f);
>> F(-0.23,2.7)

ans =

-0.0964


2 Evaluate the function g ( x, y ) =sin(2 x + 1) tan( y − 12 ) for x = 0.45, y = −1.17
(a) Using the subs command.
(b) By conversion into a MATLAB function.

Solution
(a)
>> g = sym('sin(2*x+1)*tan(y-1/2)');
>> x = 0.45; y = -1.17;
>> double(subs(g))

ans =

9.5076

(b)
>> G = matlabFunction(g);
>> G(0.45,-1.17)

ans =

9.5076


 xy + 1 
3 Evaluate the vector function v( x, y ) =   = =
for x 1.54, y 2.28
x − 2 y
(a) Using the subs command.
(b) By conversion into a MATLAB function.

, 2


Solution
(a)
>> v = sym('[x*y+1;x-2*y]');
>> x = 1.54; y = 2.28;
>> double(subs(v))

ans =

4.5112
-3.0200

(b)
>> V = matlabFunction(v);
>> V(1.54,2.28)

ans =

4.5112
-3.0200


 y 3x − y 
4 Evaluate the matrix function m( x, y ) =   for x =
−2, y =
3.35
 x + 1 sin 2 y 
(a) Using the subs command.
(b) By conversion into a MATLAB function.

Solution
(a)
>> m = sym('[y 3*x-y;x+1 sin(2*y)]');
>> x = -2; y = 3.35;
>> double(subs(m))

ans =

3.3500 -9.3500
-1.0000 0.4048

(b)
>> M = matlabFunction(m);
>> M(-2,3.35)

ans =

3.3500 -9.3500
-1.0000 0.4048


5 If f (t ) = e −3t /5 + t ln(t + 1) , evaluate df / dt when t = 4.4
(a) Using the subs command.
(b) By conversion into a MATLAB function.

, 3

Solution
(a)
>> f = sym('exp(-3*t/5)+t*log(t+1)');
>> df = diff(f); t = 4.4;
>> double(subs(df))

ans =

2.4584

(b)
>> dF = matlabFunction(df);
>> dF(4.4)

ans =

2.4584


6 If g= ( x) 23 x −1 + e − x cos x , evaluate dg / dx when x = 1.37
(a) Using the subs command.
(b) By conversion into a MATLAB function.

Solution
(a)
>> g = sym('2^(3*x-1)+exp(-x)*cos(x)');
>> dg = diff(g); x = 1.37;
>> double(subs(dg))

ans =

17.6539

(b)
>> dG = matlabFunction(dg);
>> dG(1.37)

ans =

17.6539


7 Solve the following initial-value problem, and evaluate the solution at x = 3.5 .

′ + xy 2 x , =
( x − 1) y= y (2) 1
Solution
>> y = dsolve('(x-1)*Dy+x*y=2*x','y(2)=1','x');
>> y = matlabFunction(y); y(3.5)

ans =

1.9107

, 4


8 Solve the following initial-value problem, and evaluate the solution at t = 2.8 .

tx + x =et , x(1) =−1
Solution
>> x = dsolve('t*Dx+x=exp(t)','x(1)=-1');
>> x = matlabFunction(x); x(2.8)

ans =
4.5451


9 Plot y1 (t ) = e − t /3 cos( 12 t ) and y2 (t )= (t + 1)e − t versus 0 ≤ t ≤ 10 in the same graph. Adjust the
limits on the vertical axis to −0.3 and 1.1 . Add grid and label.

Solution
>> syms t
>> y1 = exp(-t/3)*cos(t/2); y2 = (t+1)*exp(-t);
>> ezplot(y1,[0,10])
>> hold on
>> ezplot(y2,[0,10])


1


0.8
y2
y1
0.6


0.4


0.2


0


-0.2

0 1 2 3 4 5 6 7 8 9 10
t


Figure Review1No9


10 Plot x1,2,3 (t ) = e − at /2 sin( 13 t ) , corresponding to a = 1, 2,3 , versus 0 ≤ t ≤ 5 in the same graph.
Adjust the limits on the vertical axis to −0.05 and 0.3 . Add grid and label.

Solution
>> syms t
>> x1 = exp(-t/2)*sin(t/3);
>> x2 = exp(-t)*sin(t/3);
>> x3 = exp(-3*t/2)*sin(t/3);
>> ezplot(x1,[0,5])
>> hold on
>> ezplot(x2,[0,5])
>> hold on
>> ezplot(x3,[0,5])

Voordelen van het kopen van samenvattingen bij Stuvia op een rij:

√  	Verzekerd van kwaliteit door reviews

√ Verzekerd van kwaliteit door reviews

Stuvia-klanten hebben meer dan 700.000 samenvattingen beoordeeld. Zo weet je zeker dat je de beste documenten koopt!

Snel en makkelijk kopen

Snel en makkelijk kopen

Je betaalt supersnel en eenmalig met iDeal, Bancontact of creditcard voor de samenvatting. Zonder lidmaatschap.

Focus op de essentie

Focus op de essentie

Samenvattingen worden geschreven voor en door anderen. Daarom zijn de samenvattingen altijd betrouwbaar en actueel. Zo kom je snel tot de kern!

Veelgestelde vragen

Wat krijg ik als ik dit document koop?

Je krijgt een PDF, die direct beschikbaar is na je aankoop. Het gekochte document is altijd, overal en oneindig toegankelijk via je profiel.

Tevredenheidsgarantie: hoe werkt dat?

Onze tevredenheidsgarantie zorgt ervoor dat je altijd een studiedocument vindt dat goed bij je past. Je vult een formulier in en onze klantenservice regelt de rest.

Van wie koop ik deze samenvatting?

Stuvia is een marktplaats, je koop dit document dus niet van ons, maar van verkoper docusity. Stuvia faciliteert de betaling aan de verkoper.

Zit ik meteen vast aan een abonnement?

Nee, je koopt alleen deze samenvatting voor €24,37. Je zit daarna nergens aan vast.

Is Stuvia te vertrouwen?

4,6 sterren op Google & Trustpilot (+1000 reviews)

Afgelopen 30 dagen zijn er 75632 samenvattingen verkocht

Opgericht in 2010, al 14 jaar dé plek om samenvattingen te kopen

Start met verkopen
€24,37
  • (0)
  Kopen