100% tevredenheidsgarantie Direct beschikbaar na betaling Zowel online als in PDF Je zit nergens aan vast
logo-home
Summary Business Research Methods - prof Cleeren €8,99
In winkelwagen

Samenvatting

Summary Business Research Methods - prof Cleeren

1 beoordeling
 5 keer verkocht

The documents are fully written in English. I made 2 separate documents, one summary for Prof Cools and one for prof Cleeren. This contains all the relevant information that is needed for the exam in January. - Also have a look at my profile for other summaries.

Voorbeeld 3 van de 30  pagina's

  • 21 december 2020
  • 30
  • 2020/2021
  • Samenvatting
Alle documenten voor dit vak (4)

1  beoordeling

review-writer-avatar

Door: pimdeboer1 • 3 jaar geleden

avatar-seller
hwstudent2
BRM – Cleeren


1. Linear regression analysis
1.1 When to use a linear regression?
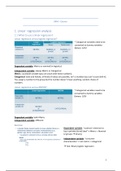
Linear regression versus logistic regression?
* Categorical variables need to be
converted to dummy variables
(binary: 1/0)!


Dependent variable: Metric or nominal (in logistics)

Independent variable: always Metric or Categorical
Metric: countable variable (you can count with these numbers).
Categorical: male and female, all kinds of values are possible, isn’t a number (you can’t count with it).
You assign a number to the group but the number doesn’t mean anything, random choice of
numbers.

Linear regression versus ANOVA?
* Categorical variables need to be
converted to dummy variables
(binary: 1/0)!


Dependent variable: both Metric
Independent variable: different

Exercise
Dependent variable: “a person´s decision to
buy a private (store) label” ≠ Metric = Nominal
(2 groups → binary)

Independent variable: “consumer
characteristics” ≠ not metric = categorical

→ Test: Binary logistic regression


1

, Dependent variable: “a person´s attitude
towards buying private (store) label” = Likert
scale → considered a Metric variable.

Independent variable: “consumer
characteristics” ≠ not metric = categorical

→ Test: Linear regression

Dependent variable: “a person´s attitude
towards buying private (store) label” =
Nominal (>2 groups)

Independent variable: “consumer
characteristics” ≠ not metric = categorical

→ Multinomial logistic regression


1.2 Creating dummy variables
• Transform categorical independent variables into dummy (1/0) variables (aka indicator
variables) in a linear (and logistic) regression
• Dummy variable trap!
o = if you would include as many dummies as response categories → you create perfect
multicollinearity, you can perfectly predict values of last category based on values of
other categories. If male = 1 → female will be 0.
o # dummies = # response categories – 1
▪ You should include 1 dummy less than the number of response categories.

HOW: Tabulate X, generate(X)

Example linear regression


2

, Control variable = which we know will influence
dependent variable/results, but we are not really
interested in their effect (there will not be a
hypothesis on this). If we do not include them →
omitted variable bias. They will be treated as
independent variables.

Subscript (i) = level of observation !


1.3 Linear regression in Stata
HOW: Regress

1.3.1 Model diagnostics – Steps
• Step 1: Check assumptions (if necessary, apply corrections)
o Assumption 1: Causality.
o Assumption 2: Were all relevant variables included?
o Assumption 3: Metric dependent variable.
o Assumption 4: Linear relationship between dependent and independent variables.
o Assumption 5: Additive relationship between dependent and independent variables.
o Assumption 6: Residuals need to be independent, normally distributed, homoscedastic,
without autocorrelation.
o Assumption 7: Enough observations
o Assumption 8: No multicollinearity
o Assumption 9: No extreme values
• Step 2: Check ‘meaningfulness’ of model (model fit); H0: R² = 0
• Step 3: Interpret the coefficients of each independent variable; H0: bi = 0

Step 1: check assumptions
ASSUMPTION 1: CAUSALITY
• Independent variables (RHS) should be causing the dependent variable.

ASSUMPTION 2: ALL RELEVANT VARIABLES
• No extreme clusters & No striking patterns
HOW: residuals versus fitted (rvf) plot - Predicted variables against residuals

ASSUMPTION 6: NORMAL DISTRIBUTION OF RESIDUALS
HOW visually: Histogram of residuals – should be normally distributed
PP-plot (probability-plot) – should be normally distributed

HOW statistically: Shapiro’s Wilk normality test – H0: residuals normally distributed
! You don’t want to reject H0, residuals will then be normally distributed.

• If violated: check why the standard errors are not normally distributed:
o Problem in model -> fix it!
o Dependent variable not normally distributed -> transformation of dependent variable
(logarithm, square, root)
• Important: if you use a transformation, it has implications for the interpretation of the results !!
(interpret in function of transformed variable).

• If the sample size is large enough → violation of normal distribution usually not a problem


3

Voordelen van het kopen van samenvattingen bij Stuvia op een rij:

√  	Verzekerd van kwaliteit door reviews

√ Verzekerd van kwaliteit door reviews

Stuvia-klanten hebben meer dan 700.000 samenvattingen beoordeeld. Zo weet je zeker dat je de beste documenten koopt!

Snel en makkelijk kopen

Snel en makkelijk kopen

Je betaalt supersnel en eenmalig met iDeal, Bancontact of creditcard voor de samenvatting. Zonder lidmaatschap.

Focus op de essentie

Focus op de essentie

Samenvattingen worden geschreven voor en door anderen. Daarom zijn de samenvattingen altijd betrouwbaar en actueel. Zo kom je snel tot de kern!

Veelgestelde vragen

Wat krijg ik als ik dit document koop?

Je krijgt een PDF, die direct beschikbaar is na je aankoop. Het gekochte document is altijd, overal en oneindig toegankelijk via je profiel.

Tevredenheidsgarantie: hoe werkt dat?

Onze tevredenheidsgarantie zorgt ervoor dat je altijd een studiedocument vindt dat goed bij je past. Je vult een formulier in en onze klantenservice regelt de rest.

Van wie koop ik deze samenvatting?

Stuvia is een marktplaats, je koop dit document dus niet van ons, maar van verkoper hwstudent2. Stuvia faciliteert de betaling aan de verkoper.

Zit ik meteen vast aan een abonnement?

Nee, je koopt alleen deze samenvatting voor €8,99. Je zit daarna nergens aan vast.

Is Stuvia te vertrouwen?

4,6 sterren op Google & Trustpilot (+1000 reviews)

Afgelopen 30 dagen zijn er 65507 samenvattingen verkocht

Opgericht in 2010, al 15 jaar dé plek om samenvattingen te kopen

Start met verkopen
€8,99  5x  verkocht
  • (1)
In winkelwagen
Toegevoegd