2aso - Samenvattingen, Notities en Examens
Op zoek naar een samenvatting over 2aso? Op deze pagina vind je 11 samenvattingen over 2aso.
Alle 11 resultaten
Sorteer op
-
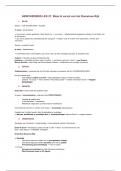
GESCHIEDENIS examencommissie 2ASO / 2D 2024
- Samenvatting • 61 pagina's • 2024
-
- €14,49
- 4x verkocht
- + meer info
Samenvatting geschiedenis voor examencommissie a.d.h.v het vakficke van 2024, Geschikt voor alle ASO / doorstroom richtingen van de tweede graad. Bevat alle nuttige info in de vorm van: teksten, schema's, afbeeldingen, filmpjes en oefeningen
-
Geschiedenis les 21 + 33 samengevat (2de middelbaar, boek: STORIA 2)
- Samenvatting • 3 pagina's • 2023
- Ook in voordeelbundel
-
- €2,99
- 3x verkocht
- + meer info
In dit document vind je 2 geschiedenislessen uit het boek Storia 2 samengevat. Ik heb ze eerst apart gemaakt, maar uiteindelijk voegde ik ze samen in 1 document.
-
Samenvatting Coup de Pouce 3 + 4 - 2ASO - EXAMENCOMMISSIE - Frans - 2e graad
- Samenvatting • 144 pagina's • 2021
-
- €15,49
- 2x verkocht
- + meer info
Samenvatting samengesteld ah vakfiches 2021 - Frans - 2 ASO. 
 
Leerwerkboek Coup de Pouce 3 + 4 als leidraad gebruikt. 
 
Veel plezier!
-
SOCIALE EN GEDRAGSWETENSCHAPPEN examencommissie 2e graad samenvatting
- Samenvatting • 1 pagina's • 2024
-
- €13,99
- + meer info
Samenvatting sociale en gedragswetenschappen voor de 2e graad examencommissie a.d.h.v het vakficke van 2024. Bevat alle te kennen leerstof in de vorm van: teksten, uitleg, schema's, afbeeldingen, filmpjes en meer dan 60 oefenvragen.
-
WK2Assgn.DraytonS.docx Quantitative Analysis: Visually Displaying Data Results RSCH 8210 A-Quantitative Reasoning and Analysis Walden University 14:48:34 GMT -05:00 The high school longitudinal study data set was used to identify two variables and
- Samenvatting • 5 pagina's • 2022
-
- €7,12
- + meer info
WK2Assgn.DraytonS.docx Quantitative Analysis: Visually Displaying Data Results RSCH 8210 A-Quantitative Reasoning and Analysis Walden University 14:48:34 GMT -05:00 The high school longitudinal study data set was used to identify two variables and visually display them for comparison. In order to visually display each variable a graph of some sort is needed. The mean of the variable X1SES (Socio-economic status composite) is .0355 displayed below in figure 1. Figure 1 The analyzation o...
Fear of missing out? Hoeft niet!
-
WK2Assgn.DraytonS.docx Quantitative Analysis: Visually Displaying Data Results RSCH 8210 A-Quantitative Reasoning and Analysis Walden University 14:48:34 GMT -05:00 The high school longitudinal study data set was used to identify two variables and
- Samenvatting • 5 pagina's • 2022
-
- €7,12
- + meer info
WK2Assgn.DraytonS.docx Quantitative Analysis: Visually Displaying Data Results RSCH 8210 A-Quantitative Reasoning and Analysis Walden University 14:48:34 GMT -05:00 The high school longitudinal study data set was used to identify two variables and visually display them for comparison. In order to visually display each variable a graph of some sort is needed. The mean of the variable X1SES (Socio-economic status composite) is .0355 displayed below in figure 1. Figure 1 The analyzation o...
-
Wk2AssignTedrowW.docx 1 Visually Displaying Data Results Walden University RSCH 8210: Quantitative Reasoning and Analysis 14:08:14 GMT -05:00 Visually Displaying Data Results Categorical Variable Using the Afrobarometer data set, with a mean age
- Samenvatting • 4 pagina's • 2022
-
- €7,12
- + meer info
Wk2AssignTedrowW.docx 1 Visually Displaying Data Results Walden University RSCH 8210: Quantitative Reasoning and Analysis 14:08:14 GMT -05:00 Visually Displaying Data Results Categorical Variable Using the Afrobarometer data set, with a mean age of 37.23, the first variable selected for visual display is the Urban or Rural Primary Sampling Unit. This is a categorical variable because all responses fall into urban, rural, or semi-urban categories. Each response carries the same weight ma...
-
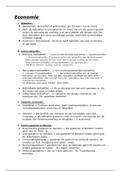
Samenvatting Examen Economie 2ASO
- Samenvatting • 24 pagina's • 2020
-
- €5,49
- 10x verkocht
- + meer info
Een complete samenvatting voor het 2de graad examen van economie voor de middenjury, hiermee ben ik van de 1ste keer geslaagd.
-
BUS517 W2Assignment.docx Increase Urgency BUS 575: Strategy for Change Increasing the urgency to affect the change of the United States Army Recruiting Command is no easy task. Although we have identified the reasons to make the appropriate changes
- Samenvatting • 5 pagina's • 2021
-
- €5,22
- + meer info
BUS517 W2A Increase Urgency BUS 575: Strategy for Change Increasing the urgency to affect the change of the United States Army Recruiting Command is no easy task. Although we have identified the reasons to make the appropriate changes and ultimately bring change to the assignments of recruiting personnel some people may be hesitant to make the required changes. The urgency needed to implement change must begin at the highest level of influence in the Army Recruiting Command. This level is...
Vraag jij je af waarom zoveel studenten in mooie kleren lopen, geld genoeg hebben en genieten van tonnen aan vrije tijd? Nou, ze verkopen hun samenvattingen op Stuvia! Stel je eens voor dat jouw samenvatting iedere dag weer wordt verkocht. Ontdek alles over verdienen op Stuvia