Shapiro wilk test - Samenvattingen, Notities en Examens
Op zoek naar een samenvatting over Shapiro wilk test? Op deze pagina vind je 42 samenvattingen over Shapiro wilk test.
Alle 42 resultaten
Sorteer op
-
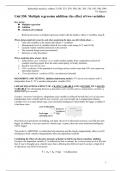
Comprehensive summary Inferential Statistics test 2 + R codes
- Samenvatting • 60 pagina's • 2023
-
- €12,49
- 10x verkocht
- + meer info
A comprehensive summary for Inferential Statistics test 2 including units 550, 553, 554, 560, 561, 563, 510, 545, 548, 591, based on the microlectures, lectures and assignments + R codes (own grade: 8.8)
-
CWP Test Questions With 100% Correct Answers Latest Updated 2024- 2025 (Graded A+)
- Tentamen (uitwerkingen) • 17 pagina's • 2024
-
- €12,75
- + meer info
CWP Test Questions With 100% Correct Answers Latest Updated (Graded A+) I am using x to predict y. When I know the value of x, the mean-squared-error of my estimate of y is less than when I don't know x. - answer-x explains some of the variance in y If the SSmodel is greater than the SSresidual... - answer-the model accounts for more than 50% of the total variance What is the coefficient of determination? - answer-The proportion of variance accounted for in the dependent variable by the ...
-
CWP Test Questions With 100% Correct Answers Latest Updated 2024/2025 (Graded A+)
- Tentamen (uitwerkingen) • 17 pagina's • 2024
-
- €13,73
- + meer info
CWP Test Questions With 100% Correct Answers Latest Updated 2024/2025 (Graded A+) f the SSmodel is greater than the SSresidual... - answer-the model accounts for more than 50% of the total variance What is the coefficient of determination? - answer-The proportion of variance accounted for in the dependent variable by the predictor variables. What is the relationship between r and beta in a simple regression? - answer-beta is an unstandardised measure of r What is the critical value for t w...
-
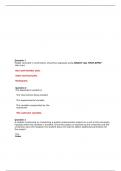
EPI 522 Midterm Quiz Summary- Rush University 2023/24
- Tentamen (uitwerkingen) • 20 pagina's • 2023
-
- €18,64
- + meer info
EPI 522 Midterm Quiz Summary- Rush University 2023/24 Height recorded in centimeters should be displayed using SELECT ALL THAT APPLY Bar chart. Box-and-whisker plot. Stem-and-leaf plot. Histogram. Question 2 The dependent variable is The intervention being studied. The experiemental variable. The variable manipulated by the researcher. The outcome variable. Question 3 A student is planning on conducting a quality improvement project on a unit in the university hospital where the s...
-
Evaluating Proof Blocks Problems as Exam Questions
- Tentamen (uitwerkingen) • 12 pagina's • 2024
-
- €14,71
- + meer info
ovide much more information across a range of ability levels than either of the other two items. Summing together multiple item information functions gives the combined information that can be gained about a given student from a set of items. To better understand the quality of information that Proof Blocks problems provide about students in a discrete mathematics course, we calculate the average item information curve for each category by summing the information curves for all t...
-
CWP Test Questions With 100% Correct Answers Latest Updated 2024- 2025 | Graded A+
- Tentamen (uitwerkingen) • 17 pagina's • 2024
-
- €12,75
- + meer info
CWP Test Questions With 100% Correct Answers Latest Updated | Graded A+. I am using x to predict y. When I know the value of x, the mean-squared-error of my estimate of y is less than when I don't know x. - answer-x explains some of the variance in y If the SSmodel is greater than the SSresidual... - answer-the model accounts for more than 50% of the total variance What is the coefficient of determination? - answer-The proportion of variance accounted for in the dependent variable by the...
-
BESC 3010 - Ch 02 UVU - Poulson Official | 2024/2025 | Graded A+
- Tentamen (uitwerkingen) • 10 pagina's • 2024
-
Ook in voordeelbundel
-
- €9,24
- + meer info
BESC 3010 - Ch 02 UVU - Poulson Official | 2024/2025 | Graded A+ What are the key characteristics that define a statistical population? A statistical population consists of all subjects or elements that share a common characteristic, and it can include individuals, objects, events, or measurements that researchers aim to study. Explain the concept of a sampling frame in research design. A sampling frame is a complete list of individuals or items from which a sample is drawn, ensuring...
-
BESC 3010 CH 4 QUESTIONS AND ANSWERS | 2024/2025 | GRADED A+
- Tentamen (uitwerkingen) • 10 pagina's • 2024
-
Ook in voordeelbundel
-
- €9,24
- + meer info
BESC 3010 CH 4 QUESTIONS AND ANSWERS | 2024/2025 | GRADED A+ What are the key features of a box plot? A box plot visually summarizes a data set's central tendency, spread, and outliers by displaying the median, quartiles, and extreme values as a rectangular box with "whiskers." How do you interpret skewness in a data distribution? Skewness indicates the asymmetry of a distribution; positive skew means more data points are concentrated on the left, while negative skew suggests...
-
CWP Test Questions With 100% Correct Answers Latest Updated 2024- 2025 | Graded A+
- Tentamen (uitwerkingen) • 17 pagina's • 2024
-
- €14,71
- + meer info
CWP Test Questions With 100% Correct Answers Latest Updated | Graded A+. I am using x to predict y. When I know the value of x, the mean-squared-error of my estimate of y is less than when I don't know x. - answer-x explains some of the variance in y If the SSmodel is greater than the SSresidual... - answer-the model accounts for more than 50% of the total variance What is the coefficient of determination? - answer-The proportion of variance accounted for in the dependent variable by the...
-
EXERCISE 26 DETERMINING THE NORMALITY OF A DISTRIBUTION TESTBANK 2024 WITH COMPLETE SOLUTIONS
- Tentamen (uitwerkingen) • 5 pagina's • 2023
-
- €15,69
- + meer info
2. How would you characterize the skewness of the distribution in Question 1—positively skewed, negatively skewed, or approximately normal? Provide a rationale for your answer. Answer: In a positively skewed distribution, the largest portion of data is below the mean, whereas in a negatively skewed distribution, the largest portion is above the mean. This distribution is negatively skewed because the age of enrollment got progressively higher/bigger with time 3. Compare the original skewne...

€5,99 voor je samenvatting, vermenigvuldigt met 100 medestudenten... Reken maar uit: dat is veel geld! Wees geen dief van je eigen portemonnee en start nu met uploaden. Ontdek alles over verdienen op Stuvia


