WEEK 1 – BUSINESS MODEL CANVAS / BALANCED SCORECARD
Business Model Canvas
- How do I design a company so that it's a good and profitable?
Balanced Scorecard
- Another strategy tool "what gets measured gets managed" / "to measure is to know"
- What can I measure to make the company better?
Four perspectives:
- Financial Stakeholders
o How to grow & sustain the company
o Manage working capital
o Financial risks
o KPI example revenue increase over time
- Customers
o Who are key customers?
o What is the key value proposition?
o KPI example number of segments over time, customer satisfaction etc.
- Operations
o Internal business process, identify the market, create product (innovation)
o Innovation:
o For the datasets, the internal business process is not always that obvious. How do we think
about KPIs? This requires brainstorming
- Employees
o Learning and growth perspective, how are employees developing?
o You want them to be productive, be satisfied, and retain them, bring results
o Hard to measure if employees are satisfied?
o We can create new columns in the dataset
Balance needed
- Financial, customer, internal, innovation, and learning
- Short-term and long-term objectives
- Financial and nonfinancial measures
- Leading and lagging indicators
- Internal and external performance
Linking Balanced Scorecard measures to strategy → idea of the course
- Come back after seeing the scorecard and see how you can change the business model
- Most common way: Cause-effect relationship
- Two ways to think about KPIs (Check Article!)
o Lagging indicator - think about KPI after metric is already there → Outcome
o Leading indicator - think about KPI before metric is there → Driver/Goal
,WEEK 2 – DATABASES AND WAREHOUSES
Database Stuff
Basics
- What is a Database?
o A collection of data that CANNOT be changed and is completely uncorrupted
o Database is the actual storage that is stored somewhere
- DBMS is a software that manages that data (In this course: MySQL)
Data is structured in relations
- What are the relations? = Table
o There is a relation between each column and the other column
o But there is also a relation between the different tables → Table relations
- Record: is a row in the table (tuple)
- Attribute: Column in the table
- Schema - Description of the table structure (columns)
- Instance - the actual data in the table
- Text / Specific connection of numbers is STRING
SQL is one language for:
- Data definition (DDL)
- Data Manipulation (DML)
- Storage definition (SDL) --> (outside the scope of this course)
Keys
Key = collection of one or more attributes
- A key uniquely defines each row of the table (record in the relation)
- Primary key is the one most important key
- Surrogate key: artificial key to function as one but doesn't have to be primary
- Foreign key: attribute(s) in a relation that form a reference to the (key of) one or more records in
another relation
- Integrity constraints
o Key constraint (maintains uniqueness)
o Foreign key constraint (maintains referential integrity)
o Other (any condition that need to be always valid)
ER Diagrams and Databases
Data Modeling (example of ING bank)
- Goals:
o Conceptual representation of the data
o “Reality” meets “bits and bytes”
o Must make sense, and be usable by other
people
- Two ways that we focus on:
o Entity-Relationship Model
→ Used for conceptual database design
o Relational Model
→ Used for logical database design
, Entity-Relationship Model (ER-Diagram)
- Entities
o An object that exists and is distinguishable from other objects (e.g. Bob Smith, BIIT)
o Have attributes (people have names and addresses)
o Form entity sets with other entities of the same type that share the same properties (Set of
all people, set of all classes)
o Entity sets may overlap (e.g. Customers and Employees)
- Relationships
o Relate 2 or more entities (e.g. Bjorn has an account at the Enschede Branch)
o Form relationship sets with other relationships of the same type that share the same
properties (e.g. Customers have accounts at Branches)
o Can have attributes: “has account at” may have an attribute start-date
o Can involve more than 2 entities (Employee works at Branch at Job)
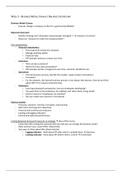
Starting example of ER Diagram
- Rectangles = Entities
- Diamonds = Relationship
- Ellipses = Attributes
Cardinalities
- Customer might only be able to open one
account - one-to-one relationship
- Customer might be able to open several accounts - one-to-many
- Representing this is important!
o Better manipulation of data
o Can enforce such a constraint
o If not represented in conceptual model, the domain knowledge may be lost
Mapping the Cardinalities
- Express the number of entities to which another entity
- can be associated via a relationship set
- Most useful in describing binary relationship sets
- N-ary relationships?
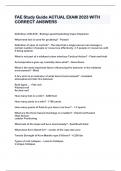
Bachman style
- One to one, starting point one e.g. for employees because
company would not exist without at least 1 employee
- Zero to one, starting point is zero e.g. for projects, because
there might be no projects yet
- The side that has the arrow is the "more/many" side
Chen Style
Uses M/N to
represent
Information
Engineering Style
Using stripes and
different symbols
Business Model Canvas
- How do I design a company so that it's a good and profitable?
Balanced Scorecard
- Another strategy tool "what gets measured gets managed" / "to measure is to know"
- What can I measure to make the company better?
Four perspectives:
- Financial Stakeholders
o How to grow & sustain the company
o Manage working capital
o Financial risks
o KPI example revenue increase over time
- Customers
o Who are key customers?
o What is the key value proposition?
o KPI example number of segments over time, customer satisfaction etc.
- Operations
o Internal business process, identify the market, create product (innovation)
o Innovation:
o For the datasets, the internal business process is not always that obvious. How do we think
about KPIs? This requires brainstorming
- Employees
o Learning and growth perspective, how are employees developing?
o You want them to be productive, be satisfied, and retain them, bring results
o Hard to measure if employees are satisfied?
o We can create new columns in the dataset
Balance needed
- Financial, customer, internal, innovation, and learning
- Short-term and long-term objectives
- Financial and nonfinancial measures
- Leading and lagging indicators
- Internal and external performance
Linking Balanced Scorecard measures to strategy → idea of the course
- Come back after seeing the scorecard and see how you can change the business model
- Most common way: Cause-effect relationship
- Two ways to think about KPIs (Check Article!)
o Lagging indicator - think about KPI after metric is already there → Outcome
o Leading indicator - think about KPI before metric is there → Driver/Goal
,WEEK 2 – DATABASES AND WAREHOUSES
Database Stuff
Basics
- What is a Database?
o A collection of data that CANNOT be changed and is completely uncorrupted
o Database is the actual storage that is stored somewhere
- DBMS is a software that manages that data (In this course: MySQL)
Data is structured in relations
- What are the relations? = Table
o There is a relation between each column and the other column
o But there is also a relation between the different tables → Table relations
- Record: is a row in the table (tuple)
- Attribute: Column in the table
- Schema - Description of the table structure (columns)
- Instance - the actual data in the table
- Text / Specific connection of numbers is STRING
SQL is one language for:
- Data definition (DDL)
- Data Manipulation (DML)
- Storage definition (SDL) --> (outside the scope of this course)
Keys
Key = collection of one or more attributes
- A key uniquely defines each row of the table (record in the relation)
- Primary key is the one most important key
- Surrogate key: artificial key to function as one but doesn't have to be primary
- Foreign key: attribute(s) in a relation that form a reference to the (key of) one or more records in
another relation
- Integrity constraints
o Key constraint (maintains uniqueness)
o Foreign key constraint (maintains referential integrity)
o Other (any condition that need to be always valid)
ER Diagrams and Databases
Data Modeling (example of ING bank)
- Goals:
o Conceptual representation of the data
o “Reality” meets “bits and bytes”
o Must make sense, and be usable by other
people
- Two ways that we focus on:
o Entity-Relationship Model
→ Used for conceptual database design
o Relational Model
→ Used for logical database design
, Entity-Relationship Model (ER-Diagram)
- Entities
o An object that exists and is distinguishable from other objects (e.g. Bob Smith, BIIT)
o Have attributes (people have names and addresses)
o Form entity sets with other entities of the same type that share the same properties (Set of
all people, set of all classes)
o Entity sets may overlap (e.g. Customers and Employees)
- Relationships
o Relate 2 or more entities (e.g. Bjorn has an account at the Enschede Branch)
o Form relationship sets with other relationships of the same type that share the same
properties (e.g. Customers have accounts at Branches)
o Can have attributes: “has account at” may have an attribute start-date
o Can involve more than 2 entities (Employee works at Branch at Job)
Starting example of ER Diagram
- Rectangles = Entities
- Diamonds = Relationship
- Ellipses = Attributes
Cardinalities
- Customer might only be able to open one
account - one-to-one relationship
- Customer might be able to open several accounts - one-to-many
- Representing this is important!
o Better manipulation of data
o Can enforce such a constraint
o If not represented in conceptual model, the domain knowledge may be lost
Mapping the Cardinalities
- Express the number of entities to which another entity
- can be associated via a relationship set
- Most useful in describing binary relationship sets
- N-ary relationships?
Bachman style
- One to one, starting point one e.g. for employees because
company would not exist without at least 1 employee
- Zero to one, starting point is zero e.g. for projects, because
there might be no projects yet
- The side that has the arrow is the "more/many" side
Chen Style
Uses M/N to
represent
Information
Engineering Style
Using stripes and
different symbols