100 Case Studies in Pathophysiology by Harold J. B
Chamberlain College Nursing
Page 4 out of 101 results
Sort by
-
BIO 182 Based on the mean and standard deviation of the historical death rates, what is th
- Summary • 3 pages • 2024
-
- $7.99
- + learn more
BIO 182 Based on the mean and standard deviation of the historical death rates, what is th BIO 182 Based on the mean and standard deviation of the historical death rates, what is the probability of observing a death rate more extreme than (less than or greater than, depending on your answer to question 22) the death rate observed in 2011, 2012, or 2013? Express your answer as a percentage (%). Round all calculated values to the nearest hundredth of a decimal place. For example, if you calculate...
-
BIO 182 Be sure to discuss the assumptions of a normal probability distribution and why, b
- Summary • 2 pages • 2024
-
- $7.99
- + learn more
BIO 182 Be sure to discuss the assumptions of a normal probability distribution and why, b BIO 182 Be sure to discuss the assumptions of a normal probability distribution and why, based on the frequency distribution, these assumptions seem appropriate (or not) for modeling the body temperature of a healthy frogcat. Assumptions of a Normal Probability DistributionA normal probability distribution, also known as a Gaussian distribution, is a type of continuous probability distribution for a real...
-
BIO 182 Between 2011 and 2013, researchers used the method of "mark and recapture" to esti
- Summary • 3 pages • 2024
-
- $7.99
- + learn more
BIO 182 Between 2011 and 2013, researchers used the method of "mark and recapture" to esti BIO 182 Between 2011 and 2013, researchers used the method of "mark and recapture" to estimate the number of monitors each year. The results are shown in the table below.Year (post cane toad)Number of Mitchells water monitors (individuals per transect)To be determinedDirections: For questions 15-16, use the following data to estimate the number of Mitchells water monitors for 2013: Number of GPS-tagg...
-
BIO 182 Calculate the probability of observing a historical density that is more extreme t
- Summary • 2 pages • 2024
-
- $7.99
- + learn more
BIO 182 Calculate the probability of observing a historical density that is more extreme t BIO 182 Calculate the probability of observing a historical density that is more extreme than the current density of 27,000 m2 km-2 (either less than or greater than the current density, depending on your answer to question 11). Express your answer as a percentage (%). Round all calculated values to the nearest whole number. For example, if you calculate the value as 213.8218, round to 214.To calculate th...
-
BIO 182 Construct a matrix showing the connections between predators and prey in the Austr
- Summary • 2 pages • 2024
-
- $7.99
- + learn more
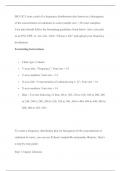
BIO 182 Construct a matrix showing the connections between predators and prey in the Austr BIO 182 Construct a matrix showing the connections between predators and prey in the Australian community. In the matrix shown below, potential predators are listed in rows and potential prey are listed in columns. Sure, I can help you construct a matrix showing the connections between predators and prey in the Australian community. Let's consider a few examples of Australian predators and their prey:...
-
BIO 182 Create a plot of a frequency distribution (also known as a histogram) of the conce
- Summary • 3 pages • 2024
-
- $7.99
- + learn more
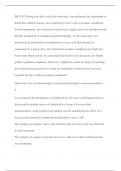
BIO 182 Create a plot of a frequency distribution (also known as a histogram) of the conce BIO 182 Create a plot of a frequency distribution (also known as a histogram) of the concentration of cadmium in water (sample size = 20 water samples). Your plot should follow the formatting guidelines listed below. Save your plot as an JPG, PDF, or .xls/.xlsx. Click œChoose a file and upload your frequency distribution. Formatting Instructions ï‚·Chart type: Columnï‚·Y-axes title: œFrequen...
-
BIO 182 During your last visit to the sanctuary, you performed an experiment to determine
- Summary • 3 pages • 2024
-
- $7.99
- + learn more
BIO 182 During your last visit to the sanctuary, you performed an experiment to determine BIO 182 During your last visit to the sanctuary, you performed an experiment to determine whether luxons were required for nerve cells to produce octaphorin. In this experiment, you removed a luxon from a single nerve cell and discovered that the production of octaphorin declined rapidly. At the same time, you monitored the production of octaphorin in a nerve cell that retained its connection to a luxon; ...
-
BIO 182 Explain how this top-down effect could have triggered the dispersal of boreblaster
- Summary • 2 pages • 2024
-
- $7.99
- + learn more
BIO 182 Explain how this top-down effect could have triggered the dispersal of boreblaster BIO 182 Explain how this top-down effect could have triggered the dispersal of boreblasters. Your answer should reference the causes of dispersal for species on Earth that the AI discussed in their mission memo.Top-Down Effects and Dispersal of BoreblastersTop-down effects refer to the influence that predators (or higher trophic levels) exert on their prey (or lower trophic levels), which can significantl...
-
BIO 182 For questions 31 “ 33, assume that the allele for metal tolerance (A2) is incomple
- Summary • 3 pages • 2024
-
- $7.99
- + learn more
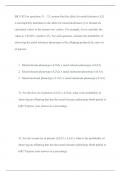
BIO 182 For questions 31 “ 33, assume that the allele for metal tolerance (A2) is incomple BIO 182 For questions 31 “ 33, assume that the allele for metal tolerance (A2) is incompletely dominant to the allele for metal intolerance (A1). Round all calculated values to the nearest ones place. For example, if you calculate the value as 3.8218%, round to 4%. For each question, estimate the probability of observing the metal tolerance phenotype in the offspring produced by each set of parents: ...
-
BIO 182 How many years will it take for the ruil population to return to its population si
- Summary • 2 pages • 2024
-
- $7.99
- + learn more
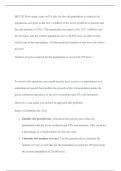
BIO 182 How many years will it take for the ruil population to return to its population si BIO 182 How many years will it take for the ruil population to return to its population size prior to the 2017 wildfires if the novel symbiont is present and the soil moisture is 24%? The population size prior to the 2017 wildfires was 42,192 trees, and the current population size is 20,985 trees. In other words, which year in the spreadsheet will the predicted number of ruil trees rise above 42,192? Num...

Do you wonder why so many students wear nice clothes, have money to spare and enjoy tons of free time? Well, they sell on Stuvia! Imagine your study notes being downloaded a dozen times for $15 each. Every. Single. Day. Discover all about earning on Stuvia


