STAT 200 (STAT200)
University Of Maryland - Baltimore
All 58 results
Sort by

-
STAT 200 Patel Maulee - Assignment #2_ Descriptive Statistics Analysis and Writeup
- Exam (elaborations) • 12 pages • 2022
-
 Greatnurse
- $12.49
- + learn more
Introduction: I am head of a household, who is 56 years old and married. I have also a university degree in Accounting and one child. Altogether with my husband, our household income is $97,000 annually. Our annual food expense is $8,700. Table 1. Variables Selected for the Analysis Variable Name in the Data Set Description Type of Variable (Qualitative or Quantitative) Variable 1: “Income” Annual household income in USD. Quantitative Variable 2: “Age Head Household” Age of t...
-
STAT 200 Week 2 Homework Problems A Graded
- Exam (elaborations) • 8 pages • 2022
-
Greatnurse
- $11.49
- + learn more
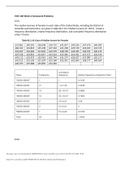
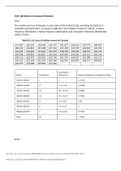
2.2.2 The median incomes of females in each state of the United States, including the District of Columbia and Puerto Rico, are given in table #2.2.10 ("Median income of," 2013). Create a frequency distribution, relative frequency distribution, and cumulative frequency distribution using 7 classes. Table #2.2.10: Data of Median Income for Females $31,862 $40,550 $36,048 $30,752 $41,817 $40,236 $47,476 $40,500 $60,332 $33,823 $35,438 $37,242 $31,238 $39,150 $34,023 $33,745 $33,269 $32,6...

-
STAT 200 - Homework 6 Solutions correctly answered
- Exam (elaborations) • 32 pages • 2022
-
Greatnurse
- $12.49
- + learn more
(3 points): Many high school students take the AP tests in different subject areas. In 2007, of the 144,796 students who took the biology exam 84,199 of them were female. In that same year, of the 211,693 students who took the calculus AB exam 102,598 of them were female ("AP exam scores," 2013). Estimate the difference in the proportion of female students taking the biology exam and female students taking the calculus AB exam using a 90% confidence level. Interpret the results. First, we...

-
STAT 200 Week 7 Homework Problems
- Exam (elaborations) • 11 pages • 2022
-
Greatnurse
- $12.49
- + learn more
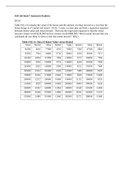
10.1.2 Table #10.1.6 contains the value of the house and the amount of rental income in a year that the house brings in ("Capital and rental," 2013). Create a scatter plot and find a regression equation between house value and rental income. Then use the regression equation to find the rental income a house worth $230,000 and for a house worth $400,000. Which rental income that you calculated do you think is closer to the true rental income? Why? Table #10.1.6: Data of House Value versus...
-
STAT 200 Week 1 to week 7
- Package deal • 7 items • 2022
-
 Havilah
- $40.49
- + learn more
STAT 200 Week 7 Homework Problems Exam (elaborations) STAT 200 Week 5 Homework Problems Exam (elaborations) STAT 200 Week 2 Homework Problems Exam (elaborations) STAT 200 Week 4 Homework Problems Exam (elaborations) STAT 200 Week 6 Homework Problems. Exam (elaborations) STAT 200 Assignment #3: Inferential Statistics Analysis and Writeup

Make study stress less painful

-
STAT 200 Week 7 Homework Problems
- Exam (elaborations) • 11 pages • 2022
-
Havilah
- $15.49
- + learn more
Table #10.1.6 contains the value of the house and the amount of rental income in a year that the house brings in ("Capital and rental," 2013). Create a scatter plot and find a regression equation between house value and rental income. Then use the regression equation to find the rental income a house worth $230,000 and for a house worth $400,000. Which rental income that you calculated do you think is closer to the true rental income? Why? Table #10.1.6: Data of House Value versus Rental ...
-
STAT 200 Week 5 Homework Problems
- Exam (elaborations) • 5 pages • 2022
-
Havilah
- $14.49
- + learn more
Stephen Stigler determined in 1977 that the speed of light is 299,710.5 km/sec. In 1882, Albert Michelson had collected measurements on the speed of light ("Student t-distribution," 2013). Is there evidence to show that Michelson’s data is different from Stigler’s value of the speed of light? State the random variable, population parameter, and hypotheses. Random Variable = Speed of light. Population parameter = mean speed of light by Albert Michelson = μ>299,710.5 km/sec μ=299,...
-
STAT 200 Week 2 Homework Problems
- Exam (elaborations) • 8 pages • 2022
-
Havilah
- $14.99
- + learn more
The median incomes of females in each state of the United States, including the District of Columbia and Puerto Rico, are given in table #2.2.10 ("Median income of," 2013). Create a frequency distribution, relative frequency distribution, and cumulative frequency distribution using 7 classes. Table #2.2.10: Data of Median Income for Females $31,862 $40,550 $36,048 $30,752 $41,817 $40,236 $47,476 $40,500 $60,332 $33,823 $35,438 $37,242 $31,238 $39,150 $34,023 $33,745 $33,269 $32,684 $31,...

-
STAT 200 Week 4 Homework Problems
- Exam (elaborations) • 5 pages • 2022
-
Havilah
- $14.49
- + learn more
The commuter trains on the Red Line for the Regional Transit Authority (RTA) in Cleveland, OH, have a waiting time during peak rush hour periods of eight minutes ("2012 annual report," 2012). a.) State the random variable. x=waiting time during peak hours b.) Find the height of this uniform distribution. 1/(8-0)=0.125 c.) Find the probability of waiting between four and five minutes. P(4<x<5)=(5-4)*0.125=0.125 d.) Find the probability of waiting between three and eight minutes. ...

-
STAT 200 Week 6 Homework Problems.
- Exam (elaborations) • 11 pages • 2022
-
Havilah
- $13.49
- + learn more
9.1.2 Many high school students take the AP tests in different subject areas. In 2007, of the 144,796 students who took the biology exam 84,199 of them were female. In that same year, of the 211,693 students who took the calculus AB exam 102,598 of them were female ("AP exam scores," 2013). Estimate the difference in the proportion of female students taking the biology exam and female students taking the calculus AB exam using a 90% confidence level. n1=144,796 p1=84199/ = 0.582 q1=1-0...
