Crosstabulation - Study guides, Class notes & Summaries
Looking for the best study guides, study notes and summaries about Crosstabulation? On this page you'll find 45 study documents about Crosstabulation.
Page 3 out of 45 results
Sort by
-
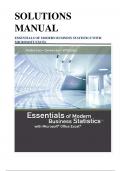
Solution Manual for Essentials of Modern Business Statistics with Microsoft® Excel®, Anderson
- Exam (elaborations) • 816 pages • 2024
-
 MedSolutions
-
- $19.99
- + learn more
Solution Manual for Essentials of Modern Business Statistics withMicrosoft® Excel®,Anderson Chapter 1 Data and Statistics Learning Objectives 1. Obtain an appreciation for the breadth of statistical applications in business and economics. 2. Understand the meaning of the terms elements, variables, and observations as they are used in statistics. 3. Obtain an understanding of the difference between categorical, quantitative, crossectional and time series data. 4. Learn about the sources of data...
-
UCF FINAL QMB 3200 STACEY BROOK SUMMER 23 - IMPORTANT INFO IN FIRST FLASHCARD.
- Exam (elaborations) • 36 pages • 2023
-
 BRAINBOOSTERS
-
- $15.49
- + learn more
IMPORTANT PRACTICE TEST INFORMATION!!!! This may be even more helpful than this quizlet!!!! In mindtap go to the left-hand toolbar, select courses, and select this course. You should see a dashboard with the chapters on the left and your recent homework scores on the right. Then on chapter 1 click the down arrow to display all of the sub categories. You should see the last sub category it is chapter 1 review and assignments- click on this then click chapter 1 test prep. This will take yo...
-
MATH 110 Terms Module 2- Exam Solution Manual Fully Solved Graded A+
- Exam (elaborations) • 2 pages • 2025
- Available in package deal
-
 TutorJosh
-
- $8.49
- + learn more
MATH 110 Terms Module 2- Exam Solution Manual Fully Solved Graded A+ frequency distribution - Answers a tabular representation of the summary data that shows the numerical count of items in each class in the data set relative frequency - Answers proportion/fraction of items in each category relative percentage - Answers proportion of items in each category given as a percentage of the whole three types of charts discussed for qualitative data descriptive statistics - Answers column chart b...
-
Solution Manual for Essentials of Modern Business Statistics with Microsoft® Excel®, Anderson
- Exam (elaborations) • 816 pages • 2024
-
 Reenstudyguides
-
- $17.99
- + learn more
Solution Manual for Essentials of Modern Business Statistics withMicrosoft® Excel®,Anderson Chapter 1 Data and Statistics Learning Objectives 1. Obtain an appreciation for the breadth of statistical applications in business and economics. 2. Understand the meaning of the terms elements, variables, and observations as they are used in statistics. 3. Obtain an understanding of the difference between categorical, quantitative, crossectional and time series data. 4. Learn about the sources of data...
-
NR 503 Mid Term Study Guide
- Exam (elaborations) • 12 pages • 2024
-
 Agradestuvia
-
- $18.49
- + learn more
NR 503 Mid Term Study Guide1. Understand and compare the different measures of morbidity a. Incidence and prevalence i. Define And transalence rate is the proportion of the population that has a health condition at a point in time. For example, 70 influenza case-patients in March 2005 reported in County A. Incidence rate or person-time rate is a measure of incidence that incorporates time directly into the denominator. Incidence refers to the occurrence of new cases of disease or injury in a ...
-
DSC 210 Final Exam (with 100% Errorless answers)
- Exam (elaborations) • 11 pages • 2023
-
 FullyFocus
-
- $10.99
- + learn more
Quarterly sales data is an example of what type of data? correct answers time-series Which of the following would likely display a negative relationship when creating a scatter diagram? correct answers the number of classes a student misses during a semester and the grade obtained in the course A dot plot can be used to display _____ correct answers the distribution of one quantitative variable The summaries of data, which may be tabular, graphical, or numerical, are referred to as: cor...
-
Introductory Statistics Exam Questions with Verified Answers Rated A+ (Already Passed)
- Exam (elaborations) • 9 pages • 2024
-
 TutorJosh
-
- $7.99
- + learn more
Introductory Statistics Exam Questions with Verified Answers Rated A+ (Already Passed) Descriptive statistics - Answers refers to numerical facts such as averages, medians, percents, and index numbers that help us understand the reality via available data. Data - Answers are facts and figures collected, analysed and summarized for presentation and interpretation data set - Answers is a collection of all data in a particular study elements - Answers are the entities on which data are collecte...
-
WGU D174 UNIT 3 Marketing Management Questions and Answers Rated A
- Exam (elaborations) • 18 pages • 2023
-
Available in package deal
-
 BrilliantScores
-
- $9.99
- + learn more
WGU D174 UNIT 3 Marketing Management Questions and Answers Rated A What are examples of types of market research that are appropriate ways to select a target market? Choose two. Buyer behavior analysis Needs assessment Correct! Appropriate kinds of market research for the selection of a target market are identification of segmentation, market segmentation study, needs assessment, determination of purchase criteria, buyer behavior analysis, and market demand estimation. All these types of market...
-
Test Bank for Modern Business Statistics with Microsoft Excel 5th Edition by Anderson Sweeney and Williams
- Exam (elaborations) • 48 pages • 2023
-
 Intelligentexceller17
-
- $14.99
- + learn more
Test Bank for Modern Business Statistics with Microsoft Excel 5th Edition by Anderson Sweeney and Williams CHAPTER 2—DESCRIPTIVE STATISTICS: TABULAR AND GRAPHICAL DISPLAYS MULTIPLE CHOICE 1. The minimum number of variables represented in a bar chart is a. 1 b. 2 c. 3 d. 4 ANS: A 2. The minimum number of variables represented in a histogram is a. 1 b. 2 c. 3 d. 4 ANS: A 3. Which of the following graphical methods is most appropriate for categorical data? a. ogive b. pie cha...

-
Computer Applications in Psychology Chapters 8 Week 7
- Class notes • 11 pages • 2024
-
 scotthedge
-
- $3.99
- + learn more
Delve into the fundamental concepts of computer applications in psychology with this comprehensive document focusing on Chapters 8 and Week 7 learning objectives. Gain a deeper understanding of statistical analysis techniques crucial in psychological research. Explore the purpose and utility of crosstabulation, unraveling its significance in organizing and analyzing categorical data. Learn to discern patterns and relationships within datasets, enhancing your ability to draw meaningful conclus...

$6.50 for your textbook summary multiplied by 100 fellow students... Do the math: that's a lot of money! Don't be a thief of your own wallet and start uploading yours now. Discover all about earning on Stuvia


