Class notes
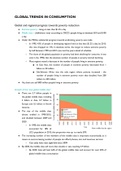
IB Geography Unit 3 (Global resource consumption and security) notes
- Course
- Institution
- Book
Complete notes for IB Geography Unit 3 (Global resource consumption and security), with all material required by the guide (including mandatory case studies), as well as additional case studies
[Show more]