100% satisfaction guarantee Immediately available after payment Both online and in PDF No strings attached
logo-home
Samenvatting Experimenteel en Correlationeel onderzoek week 2 - Enkelvoudige lineaire regressie CA$7.52   Add to cart

Summary

Samenvatting Experimenteel en Correlationeel onderzoek week 2 - Enkelvoudige lineaire regressie

 4 views  0 purchase
  • Course
  • Institution

Samenvatting over de stof uit week 2 van Experimenteel en Correlationeel onderzoek, met als hoofdonderwerp: Enkelvoudige lineaire regressie.

Preview 1 out of 4  pages

  • September 15, 2022
  • 4
  • 2019/2020
  • Summary
avatar-seller
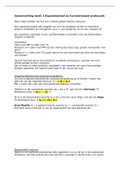
Samenvatting week 2 Experimenteel en Correlationeel onderzoek

Deze week hebben we het over enkelvoudige lineaire regressie.

Een regressie maakt het mogelijk om de ene variabele uit één of meerdere
andere variabelen te voorspellen a.d.h.v. een predictor (X) en een respons (Y).

Een predictor variabele is een onafhankelijke voorspeller voor de afhankelijke
respons variabele.

Voorbeeld:
Cijfer voor IMT & cijfer voor TS
Predictor => Cijfer voor IMT (eerste meting die basis legt, goede voorspeller voor
later)
Respons => Cijfer voor TS (volgt daarna en kan beïnvloed zijn door de resultaten
van eerder)

Op het moment dat er één predictor variabele aanwezig is, spreken we over
enkelvoudige lineaire regressie.
Zijn er twee of meer predictor variabelen, dan spreken we over meervoudige
lineaire regressie. Dit laatste komt later in de cursus aan bod.


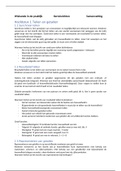
Ongestandaariseerde regressievergelijking
Om een ongestandaardiseerde regressievergelijking op te stellen, maken we
gebruik van de volgende formule  ^y = b0 + b1 x
NB. ^y staat hier voor een voorspelde waarde/een schatting.

Hierbij is b0 de voorspelde waarde van y als x=0, ook wel het intercept. Te
berekenen door  b0 = y – b1 ∙ x

En b1 is de hoeveelheid verschil in ^y als x met een punt stijgt, ook wel de slope.
Te berekenen door  b1 = r ∙(SY : SX)

Error/Residu (ei ) = geobserveerde waarde (yi ) − voorspelde waarde ( ^y i )
Wanneer deze minimaal is, zal de regressielijn het best passend zijn.


Regressielijn tekenen
Nadat je de regressievergelijking hebt opgesteld, kun je de lijn in de scatterplot
intekenen. Dit doe je door één voor één de x-waardes in de formule in te vullen

The benefits of buying summaries with Stuvia:

Guaranteed quality through customer reviews

Guaranteed quality through customer reviews

Stuvia customers have reviewed more than 700,000 summaries. This how you know that you are buying the best documents.

Quick and easy check-out

Quick and easy check-out

You can quickly pay through credit card or Stuvia-credit for the summaries. There is no membership needed.

Focus on what matters

Focus on what matters

Your fellow students write the study notes themselves, which is why the documents are always reliable and up-to-date. This ensures you quickly get to the core!

Frequently asked questions

What do I get when I buy this document?

You get a PDF, available immediately after your purchase. The purchased document is accessible anytime, anywhere and indefinitely through your profile.

Satisfaction guarantee: how does it work?

Our satisfaction guarantee ensures that you always find a study document that suits you well. You fill out a form, and our customer service team takes care of the rest.

Who am I buying these notes from?

Stuvia is a marketplace, so you are not buying this document from us, but from seller IsaN99. Stuvia facilitates payment to the seller.

Will I be stuck with a subscription?

No, you only buy these notes for CA$7.52. You're not tied to anything after your purchase.

Can Stuvia be trusted?

4.6 stars on Google & Trustpilot (+1000 reviews)

73918 documents were sold in the last 30 days

Founded in 2010, the go-to place to buy study notes for 14 years now

Start selling

Recently viewed by you


CA$7.52
  • (0)
  Add to cart