ECON 227
(Fall 2021)
Math Review
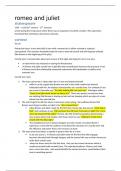
Roots :
Identifiable factorizations
Si a = b*c,
§ x2 + y2
= (x + y)(x + y) - √a = √b*√c
§ x2 − y2 = (x + y)(x − y)
§ x3 + y3 = (x2 + y)(x2 + xy + y2) - ∛an = an/3
§ x3 − y3 = (x2 − y)(x2 + xy + y2)
- a1/n = n√a
Root of polynomials
- am/n = n√am
§ ax2 + bx + c = 0
- (n√a)n = a
x1 = − b + √b2 – 4ac
2a - n√an =|a| if n is even
=a if n is odd
x2 = − b − √b2 – 4ac
2a - n√an * n√bn = n√a*b
Exponentials - m√n√a = m*n√a
§ xn = e * e * e … * x (n times) Logarithm :
§ x0 = 1
§ x−n = _1_ - by = x <=> y = logb x
an b>0
§ xm + xn = xm+n x>0
- common logarithm
§ _xm_ b = 10 log10 x
xn = xm−n
- natural logarithm
§ x1/2 = √a b= e loge x <=> ln x
§ x3/2 = √a3
- logb (x*y) = logb x + logb y
§ x2/3 = ∛a2
- logb (x/y) = logb x - logb y
§ (xm)n = xm*n
- logb xn = n * logb x
§ (x*y)n = xn*yn
- logb x = _loga x_
§ (x/y)n = xn/yn loga b
- eln x = x
§ x1/n = n√x - ln(ex)= x
- ln(1) = 0
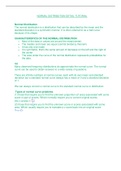
, Chapter 1 - Numerical variable
Discrete variable :
has a finite number of values
Decision making in an uncertain environment : Continuous variable :
- Everyday decisions are made based on take values within a given range of real numbers
incomplete information (stock price, $ amount of a good)
- Data is used to assist decision making = values vary on the precision of the
measurement
1/ Random and systematic sampling :
- Categorical variable
- Population : all items of interest or under Nominal variable :
investigation (N represents the population Can be placed in categories, but cannot be ranked
size) Ordinal variable :
- Sample : observed subset of the population Can be placed in categories, and can be ranked
(n represents the population)
= random sample
=systematic sample
Parameter : specific characteristic of a
population
- Statistic : specific characteristic of a sample
Systematic sample : N / n = j.
Select a random number from 1 to j, and select
the same number every time from 1 to j Chapter 2
1.2 Types of statistics
- Descriptive statistics :
Uses numerical and graphical methods to explore
data
Ex : tables, graphs, summarizing data by statistics
- Statistical inference :
Use data to make predictions, forecasts/estimates
to assist decision making
= draw conclusions on a population based on
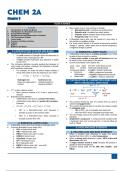
sample results 1/ Describing data numerically
2/ Types of variables
, 2/ Central tendency Pth percentile = (P/100)(n+1)
Mean : 1+2+…+n
n
Median : n+1
2 = xth position in the data
= not skewed by extreme values
3/ Variation
2.1 Geometric mean
Geometric mean : is used to measure the rate of Range
change of a variable over time
Interquartile
range
=
Geometric mean rate of return : can be used to Population (u =
measure the rate of return over time mean)
(investment…) Variance
(xi is the rate of return at the time i) Population Standard
Deviation
2.2 Percentiles and quartiles
Quartiles split ranked data into 4 segments, with Sample
an equal amount of values per segment Variance
Sample Standard
Deviation
= only 25% of observations are greater to the
third quartile
3.2 Coefficient of variation
Population coefficient
Of variation
(Fall 2021)
Math Review
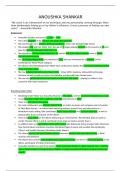
Roots :
Identifiable factorizations
Si a = b*c,
§ x2 + y2
= (x + y)(x + y) - √a = √b*√c
§ x2 − y2 = (x + y)(x − y)
§ x3 + y3 = (x2 + y)(x2 + xy + y2) - ∛an = an/3
§ x3 − y3 = (x2 − y)(x2 + xy + y2)
- a1/n = n√a
Root of polynomials
- am/n = n√am
§ ax2 + bx + c = 0
- (n√a)n = a
x1 = − b + √b2 – 4ac
2a - n√an =|a| if n is even
=a if n is odd
x2 = − b − √b2 – 4ac
2a - n√an * n√bn = n√a*b
Exponentials - m√n√a = m*n√a
§ xn = e * e * e … * x (n times) Logarithm :
§ x0 = 1
§ x−n = _1_ - by = x <=> y = logb x
an b>0
§ xm + xn = xm+n x>0
- common logarithm
§ _xm_ b = 10 log10 x
xn = xm−n
- natural logarithm
§ x1/2 = √a b= e loge x <=> ln x
§ x3/2 = √a3
- logb (x*y) = logb x + logb y
§ x2/3 = ∛a2
- logb (x/y) = logb x - logb y
§ (xm)n = xm*n
- logb xn = n * logb x
§ (x*y)n = xn*yn
- logb x = _loga x_
§ (x/y)n = xn/yn loga b
- eln x = x
§ x1/n = n√x - ln(ex)= x
- ln(1) = 0
, Chapter 1 - Numerical variable
Discrete variable :
has a finite number of values
Decision making in an uncertain environment : Continuous variable :
- Everyday decisions are made based on take values within a given range of real numbers
incomplete information (stock price, $ amount of a good)
- Data is used to assist decision making = values vary on the precision of the
measurement
1/ Random and systematic sampling :
- Categorical variable
- Population : all items of interest or under Nominal variable :
investigation (N represents the population Can be placed in categories, but cannot be ranked
size) Ordinal variable :
- Sample : observed subset of the population Can be placed in categories, and can be ranked
(n represents the population)
= random sample
=systematic sample
Parameter : specific characteristic of a
population
- Statistic : specific characteristic of a sample
Systematic sample : N / n = j.
Select a random number from 1 to j, and select
the same number every time from 1 to j Chapter 2
1.2 Types of statistics
- Descriptive statistics :
Uses numerical and graphical methods to explore
data
Ex : tables, graphs, summarizing data by statistics
- Statistical inference :
Use data to make predictions, forecasts/estimates
to assist decision making
= draw conclusions on a population based on
sample results 1/ Describing data numerically
2/ Types of variables
, 2/ Central tendency Pth percentile = (P/100)(n+1)
Mean : 1+2+…+n
n
Median : n+1
2 = xth position in the data
= not skewed by extreme values
3/ Variation
2.1 Geometric mean
Geometric mean : is used to measure the rate of Range
change of a variable over time
Interquartile
range
=
Geometric mean rate of return : can be used to Population (u =
measure the rate of return over time mean)
(investment…) Variance
(xi is the rate of return at the time i) Population Standard
Deviation
2.2 Percentiles and quartiles
Quartiles split ranked data into 4 segments, with Sample
an equal amount of values per segment Variance
Sample Standard
Deviation
= only 25% of observations are greater to the
third quartile
3.2 Coefficient of variation
Population coefficient
Of variation