Stat 431 ASSIGNMENT 3 SOLUTIONS
1. (a) Given the tolerance distribution, the probability of response the dose x is
Zx
exp((u − µ)/δ)
π(x) = du
δ(1 + exp((u − µ)/δ)2
−∞
exp((x − µ)/δ)
=
1 + exp((x − µ)/δ)
π(x) µ 1
⇒ log = − + x
1 − π(x) δ δ
This implies that it is most appropriate to choose a logistic link function.
(b) The binary logistic regression model is
π(x)
log = β0 + β1 x
1 − π(x)
where β0 = − µδ and β1 = 1δ .
(c) The R code and output for fitting the logistic regression model are given below:
# Input the data
ammonia.dat<-read.table("ammonia.dat",header=T)
# Construct the response variable for logistic regression
ammonia.dat$resp<-cbind(ammonia.dat$y,ammonia.dat$m-ammonia.dat$y)
# Fit a dose response model using the logit model.
model.1<-glm(resp~z,family=binomial(link=logit),data=ammonia.dat)
summary(model.1)
Coefficients:
Value Std. Error t value
(Intercept) -16.49433 1.458861 -11.30631
z 18.51255 1.599858 11.57137
(Dispersion Parameter for Binomial family taken to be 1 )
Null Deviance: 286.8762 on 7 degrees of freedom
Residual Deviance: 3.181074 on 6 degrees of freedom
# Determine p-value of residual deviance
1-pchisq(3.181074, 6)
[1] 0.7858011
From the above output, we see the residual deviance given by D = 3.181074 with 6 d.f.,
and p-value= D(χ2(6) > 3.181074) = 0.7858011, this indicates that the logistic model
does provide a good fit to the observed data.
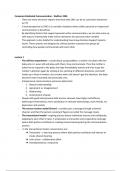
The R code for producing the dose-response curve are given below:
beta<-model.1$coefficients
dose<-seq(0.7, 1.15, by=0.0001)
x<-cbind(rep(1, length(dose)), dose)
prob<-exp(x%*%beta)/(1+exp(x%*%beta))
1
, plot(ammonia.dat$z, ammonia.dat$y/ammonia.dat$m, xlim=c(0.7, 1.15),
ylim=c(0, 1), xlab="dose", ylab="Probability of response")
lines(dose, prob)
title("Dose-Response Curve")
Dose-Response Curve
1.0
•
•
•
•
0.8
Probability of response
•
0.6
0.4
•
0.2
•
•
0.0
0.7 0.8 0.9 1.0 1.1
dose
From the plot, we see the observed probabilities of response (the dots) and the estimated
probabilities of response (the curve) from the fitted logistic regression model agree quite
well, which also implies that the model fits the data well.
(d) Realize that the tolerance distribution is actually logistic distribution. You can just
recognize this and use the result that the variance of the logistic distribution is
π2δ2
σ2 = .
3
Alternatively, you can try to derive the variance by first finding the MGF of this distribu-
tion function: M (t) = eµt Γ(1+δt)Γ(1−δt) and then the variance is just M 00 (0)−(M 0 (0))2 .
The CI for β1 is (15.37683, 21.64827)), so the CI for the variance of u is
(π 2 (1/βˆ1 ))2 /3, π 2 (1/βˆ1 )2 /3)
= (π 2 (1/21.64827)2 /3, π 2 (1/15.37683)2 /3) = (0.007019919, 0.01391377)
2
1. (a) Given the tolerance distribution, the probability of response the dose x is
Zx
exp((u − µ)/δ)
π(x) = du
δ(1 + exp((u − µ)/δ)2
−∞
exp((x − µ)/δ)
=
1 + exp((x − µ)/δ)
π(x) µ 1
⇒ log = − + x
1 − π(x) δ δ
This implies that it is most appropriate to choose a logistic link function.
(b) The binary logistic regression model is
π(x)
log = β0 + β1 x
1 − π(x)
where β0 = − µδ and β1 = 1δ .
(c) The R code and output for fitting the logistic regression model are given below:
# Input the data
ammonia.dat<-read.table("ammonia.dat",header=T)
# Construct the response variable for logistic regression
ammonia.dat$resp<-cbind(ammonia.dat$y,ammonia.dat$m-ammonia.dat$y)
# Fit a dose response model using the logit model.
model.1<-glm(resp~z,family=binomial(link=logit),data=ammonia.dat)
summary(model.1)
Coefficients:
Value Std. Error t value
(Intercept) -16.49433 1.458861 -11.30631
z 18.51255 1.599858 11.57137
(Dispersion Parameter for Binomial family taken to be 1 )
Null Deviance: 286.8762 on 7 degrees of freedom
Residual Deviance: 3.181074 on 6 degrees of freedom
# Determine p-value of residual deviance
1-pchisq(3.181074, 6)
[1] 0.7858011
From the above output, we see the residual deviance given by D = 3.181074 with 6 d.f.,
and p-value= D(χ2(6) > 3.181074) = 0.7858011, this indicates that the logistic model
does provide a good fit to the observed data.
The R code for producing the dose-response curve are given below:
beta<-model.1$coefficients
dose<-seq(0.7, 1.15, by=0.0001)
x<-cbind(rep(1, length(dose)), dose)
prob<-exp(x%*%beta)/(1+exp(x%*%beta))
1
, plot(ammonia.dat$z, ammonia.dat$y/ammonia.dat$m, xlim=c(0.7, 1.15),
ylim=c(0, 1), xlab="dose", ylab="Probability of response")
lines(dose, prob)
title("Dose-Response Curve")
Dose-Response Curve
1.0
•
•
•
•
0.8
Probability of response
•
0.6
0.4
•
0.2
•
•
0.0
0.7 0.8 0.9 1.0 1.1
dose
From the plot, we see the observed probabilities of response (the dots) and the estimated
probabilities of response (the curve) from the fitted logistic regression model agree quite
well, which also implies that the model fits the data well.
(d) Realize that the tolerance distribution is actually logistic distribution. You can just
recognize this and use the result that the variance of the logistic distribution is
π2δ2
σ2 = .
3
Alternatively, you can try to derive the variance by first finding the MGF of this distribu-
tion function: M (t) = eµt Γ(1+δt)Γ(1−δt) and then the variance is just M 00 (0)−(M 0 (0))2 .
The CI for β1 is (15.37683, 21.64827)), so the CI for the variance of u is
(π 2 (1/βˆ1 ))2 /3, π 2 (1/βˆ1 )2 /3)
= (π 2 (1/21.64827)2 /3, π 2 (1/15.37683)2 /3) = (0.007019919, 0.01391377)
2