Summary
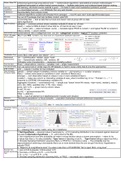
Summary STA130 Midterm Aid Sheet
- Course
- STA130
- Institution
- University Of Toronto (U Of T )
This is the study document I used to study for the midterm. We were able to use an aid sheet during the exam, and you can use this to inspire the content and layout of yours. I would add more information on confidence intervals, and more code examples.
[Show more]