100% satisfaction guarantee Immediately available after payment Both online and in PDF No strings attached
logo-home
Test Bank for Data Visualization: Exploring and Explaining with Data, 1st Edition by Camm CA$27.28   Add to cart

Exam (elaborations)

Test Bank for Data Visualization: Exploring and Explaining with Data, 1st Edition by Camm

 913 views  1 purchase
  • Course
  • Introduction to Statistics
  • Institution
  • Introduction To Statistics

Test Bank for Data Visualization: Exploring and Explaining with Data, 1st Edition 1e by Jeffrey D. Camm, James J. Cochran, Michael J. Fry, Jeffrey W. Ohlmann. Full Chapters test bank included - All MCQS given for complete chapters 1. Introduction. 2. Selecting a Chart Type. 3. Data Visuali...

[Show more]
Preview 1 out of 195  pages

  • June 2, 2023
  • 195
  • 2022/2023
  • Exam (elaborations)
  • Questions & answers
  • Introduction to Statistics
  • Introduction to Statistics
avatar-seller
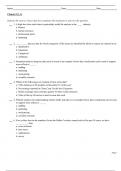
Name: Class: Date:

Chapter 01_1e

Indicate the answer choice that best completes the statement or answers the question.
1. A high-low-close stock chart is particularly useful for analysts in the _____ industry.
a. finance
b. human resources
c. professional sports
d. marketing

2. __________ data are data for which categories of like items are identified by labels or names are referred to as:
a. Quantitative
b. Numerical
c. Categorical
d. Arithmetic

3. Sentiment analysis using text data such as tweets is an example of how data visualization can be used to support
more effective _____.
a. auditing
b. marketing
c. stock pricing
d. scientific research

4. Which of the following is an example of time series data?
a. VISA balances of 30 students on December 31 of this year
b. Net earnings reported by Xena Corp. for the last 10 quarters
c. Dollar exchange rates yesterday against 10 other world currencies
d. Titles of the top 10 movies in total revenue last week

5. Website analytics for understanding website traffic and sales is an example of how data visualization can be used
to support more effective _____.
a. auditing
b. marketing
c. stock pricing
d. scientific research

6. If we collect data on the number of wins the Dallas Cowboys earned each of the past 10 years, we have
__________ data.
a. cross-sectional
b. time series
c. nonhistorical
d. survey


. Page 1

The benefits of buying summaries with Stuvia:

Guaranteed quality through customer reviews

Guaranteed quality through customer reviews

Stuvia customers have reviewed more than 700,000 summaries. This how you know that you are buying the best documents.

Quick and easy check-out

Quick and easy check-out

You can quickly pay through credit card or Stuvia-credit for the summaries. There is no membership needed.

Focus on what matters

Focus on what matters

Your fellow students write the study notes themselves, which is why the documents are always reliable and up-to-date. This ensures you quickly get to the core!

Frequently asked questions

What do I get when I buy this document?

You get a PDF, available immediately after your purchase. The purchased document is accessible anytime, anywhere and indefinitely through your profile.

Satisfaction guarantee: how does it work?

Our satisfaction guarantee ensures that you always find a study document that suits you well. You fill out a form, and our customer service team takes care of the rest.

Who am I buying these notes from?

Stuvia is a marketplace, so you are not buying this document from us, but from seller Tutor247. Stuvia facilitates payment to the seller.

Will I be stuck with a subscription?

No, you only buy these notes for CA$27.28. You're not tied to anything after your purchase.

Can Stuvia be trusted?

4.6 stars on Google & Trustpilot (+1000 reviews)

72799 documents were sold in the last 30 days

Founded in 2010, the go-to place to buy study notes for 14 years now

Start selling
CA$27.28  1x  sold
  • (0)
  Add to cart