100% satisfaction guarantee Immediately available after payment Both online and in PDF No strings attached
logo-home
8 - Internal Analysis Mindmap - Business Studies AQA A Level CA$13.35   Add to cart

Other

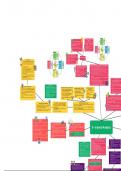
8 - Internal Analysis Mindmap - Business Studies AQA A Level

 21 views  0 purchase
  • Course
  • Institution
  • Book

Includes a PDF Download of a mindmap style poster in which colours and imagery are used to summarise the chapter including the most important details from the revision guide. Best viewed within a browser that allows to zoom in on smaller text.

Preview 1 out of 1  pages

  • June 17, 2023
  • 1
  • 2022/2023
  • Other
  • Unknown
avatar-seller
THE INTERNAL USINESS PROCESS
PERSPECTIVE
THE FINANCIAL PERSPECTIVE Q: how can we improve our processes?
Q: how do we create value for shareholders? 1. Objective: e.g. improve efficiency
1. Objective: e.g. increase profitability 2. Measures: e.g. capacity utilisation
2. Measures: e.g. ROCE 3. Target: e.g. increase labour
3. Target: e.g. increase ROCE by 3% productivity by 5%
4. Initiatives: e.g. promotional campaigns etc 4. Initiatives: e.g. try different
production methods


THE CUSTOMER PERSPECTIVE
Q: what do our customers value about us?
1. Objective: e.g. improve customer loyalty VISION & STRATEGY
2. Measures: e.g. market share
CORE COMPETENCES 3. Target: e.g. increase number of new
can be any feature that makes the business different customers by 3%
e.g. technology, specialist staff training, innovative 4. Initiatives: e.g. improved quality etc
production process, understanding of customer base
etc. METHODS OF ASSESSING PERFORMANCE - BALANCED SCORECARD MODEL
can be a combo of features THE LEARNING & GROWTH PERSPECTIVE Kaplan & Norton's Balanced Scorecard Model - used to assess business
fundamental to the success of the business and Q: how can we continue to grow and improve? performance in developing, implementing & monitoring strategy
allowing it to compete in different areas 1. Objective: e.g. improve employee uses financial and non-financial data including measures of efficiency and
should be hard for a competitor to copy and offer development effectiveness - links them to overall strategy and vision of business
benefits to the customer that would make them chose 2. Measures: e.g. labour retention looks at 4 different perspectives - managers need to consider the objectives,
it over another option 3. Target: e.g. increase labour retention by 5% measures, targets and initiatives for each one
should be able to change core competences to meet the 4. Initiatives: e.g. staff training and this process involves asking questions, choosing measures of performance and
changing demands of the market - grow and maintain development etc setting targets
competitive advantage managers need to be able to balance different perspectives as improvements in
focus on these when developing strategy one area can mean expenses for another OBJECTIVES LINKED TO THE 3 A
this model treats the business as dependant functions - all departments need must set performance objectives for each
to consider how their decisions will impact others implement the triple bottom line model
balance between internal and external stakeholders help set up and monitor strategy
can have information overload with this model and cause conflict will choose a set of measures to assess pe
KEYWORDS LIST: judge measures against targets or compar
LOOKING AT DATA OVER TIME 1. Benchmarking - looking at successful businesses
data analysis needs to be repeated regularly to see changes businesses and identifying what they do well PERFORMANCE MEASURES - HUMAN RESOURCES PERFORMANCE MEASURE - MARKETING PERFORMANCE MEASURE - some businesses publish sustainability and
financial and non-financial data show trends in performance and applying their strengths to your business calculations of labour productivity, labour OPERATIONS
- can look at their data or their processes calculations of market share, market reports
allows for assessing long and short-term performance - need 2. Extrapolation - the use of trends established turnover, labour retention, employee costs as a % growth and sales growth calculations of capacity, capacity assessing the performance makes them mo
to identity if it is a permanent or temporary trend and adapt by historical data to make predictions about of turnover, labour cost per unit Portfolio analysis - the products a utilisation, unit costs, fixed / consider each and alter behaviour if neces
strategy accordingly future values. assessment of staff skills and qualifications company has and what stage they are at in variable costs
should try and predict future trends - extrapolating to meet 3. Core Competences - the capabilities of the HR plans for training and recruitment - does it the age and condition of any
business that are unique to them, give a their life cycle, their perceived and actual
objectives match the needs of the business? quality. machinery ELKINGTON'S TRIPLE BOTTOM-LINE MODEL
competitive advantage over rivals used to measure a business's performance in relation to 3 overl
external uncertainty about the future makes this difficult assessment of staff morale and methods of the operation processes used
motivation 1. PROFIT - the traditional financial or economic value created by
2. IMPACT ON PEOPLE - a company's social values and the way
employees and the local community
ANALYSING DATA - Questions managers consider ANALYSING OVERALL PERFORMANCE 3. IMPACT OM PLANET - a company's environmental values & im
COMPARING WITH OTHER BUSINESSES managers need to ask questions and make judgements businesses need to assess strengths and weaknesses using qualitative and quantitative environment
compare data with similar businesses - compare performance need to analyse how well resources are being allocated data - important for SWOT analysis OVERLAPPING AREA = SUSTAINABILITY
to competitors, identify where improvements are needed between departments analysing non-financial data can help a business recognise the combined internal factors performance in these areas is assed and reported back to stake
comparisons help put data into context do the organisational structure and culture support the that give them a competitive advantage. the idea is that businesses are responsible to all of their stakeh
use benchmarking to compare - it needs to be comparable e.g. company's activities? measure non-financial using performance measures - data collected from each department the planet
have relevant methods to your business to compare to how good is the companies image?


HIGH GEARING
REWARDS
extra funds for expansion, funds to invest in technology that
can increase profit ASSESSING - GEARING
can be attractive in the growth phase, trying to become the gearing shows how vulnerable a business is to changes in FINANCIAL ANALYSIS - GEARING

8 - Internal Analysis
market leader interest rates gearing shows potential investors where a business' finance has
less risky when interest rates are low the more money they're borrowing = the more they will come from - how much is non-current liabilities rather than
shareholders may expect higher divedends because the struggle with rising interest rates share capital or reserves
business is focusing on profit the amount of borrowing a business can do depends on calculated using the lower part of the balance sheet
RISK profitability annd value of assets - assets offer security
investors can use gearing to help decide if they should buy GEARING (%) = non current liabilities
can't afford to repay loan and interest x100
even if interest rates are low, they can go up before the shares total equity + non current liabilities
payment is made more borrowed = more interest = less profit = less dividend for
if the business goes into liquidation shareholders won't get their shareholder
money back FINANCIAL ANALYSIS - RATIOS
firms without enough working capital suffer from poor FINANCIAL ANALYSIS - VALUE & LIMITATIONS
liquidity - it can't use its assets to pay for things when it financial analysis allows for comparing to the
KEYWORDS LIST: needs them competition and your past performance by
1. Liquidity Ratio - measures the ability of a liquidity of an asset - how easily it can be turned into cash identifying trends
company to use its near cash or quick assets to and used to buy things managers can make decisions based on
pay off its current liabilities immediately. non-current assets are NOT liquid financial strengths and weaknesses
2. Insolvent - a company is insolvent when it debtors / recievables are in between also helps potential lenders and investors to
doesn't have the current assets to pay off its when a business is insolvent, it has to quickly find money or decide
liabilities when they are due has to cease trading or go into liquidation
3. Aged Stock Analysis - lists all stock in age liquidity can be improved by decreasing stock levels,
order so the manager can discount old stock speeding up collection of debts or slowing payments to
and cut down orders for slow-selling stock creditors NON-NUMERICAL FACTORS
4. Aged Receivables Analysis - unpaid accounts liquidity ratios show how solevent a business is - how able it is ignores a lot of qualitative data that investors
are listed in order of how long they've been to pay its debts would also consider
unpaid, the most overdue are targeted first internal qualitative factors e.g. quality of staff
and products, market share, sales targets,
productivity, environmental impact and
customer satisfaction
CURRENT RATIO (working capital ratio) external factors - economic & market
compares the current assets to the current liabilities environment, what a competitor is planning,
gov legislation, tech developments, changes to
CURRENT RATIO = CURRENT ASSETS / CURRENT the location of business
VALUE OF RATIO LIABILITIES
good way of assessing performance over time - spot businesses shouldn't sell off all their stock as it would
financial trends and weaknesses if taken into account need additional capital to replace this - the current ratio
variable factors e.g. inflation, market environment would be higher than 1 to take account of this
help managers make decisions e.g. low payables days an ideal ratio is 1.5 or 2 LIMITATIONS OF INCOME STATEMENTS & BALANCE SHEETS
ratios might prompt a longer credit negotiation to a value lower than 1.5 = liquidity problem, struggle to

The benefits of buying summaries with Stuvia:

Guaranteed quality through customer reviews

Guaranteed quality through customer reviews

Stuvia customers have reviewed more than 700,000 summaries. This how you know that you are buying the best documents.

Quick and easy check-out

Quick and easy check-out

You can quickly pay through credit card or Stuvia-credit for the summaries. There is no membership needed.

Focus on what matters

Focus on what matters

Your fellow students write the study notes themselves, which is why the documents are always reliable and up-to-date. This ensures you quickly get to the core!

Frequently asked questions

What do I get when I buy this document?

You get a PDF, available immediately after your purchase. The purchased document is accessible anytime, anywhere and indefinitely through your profile.

Satisfaction guarantee: how does it work?

Our satisfaction guarantee ensures that you always find a study document that suits you well. You fill out a form, and our customer service team takes care of the rest.

Who am I buying these notes from?

Stuvia is a marketplace, so you are not buying this document from us, but from seller ceryscollins. Stuvia facilitates payment to the seller.

Will I be stuck with a subscription?

No, you only buy these notes for CA$13.35. You're not tied to anything after your purchase.

Can Stuvia be trusted?

4.6 stars on Google & Trustpilot (+1000 reviews)

64438 documents were sold in the last 30 days

Founded in 2010, the go-to place to buy study notes for 14 years now

Start selling
CA$13.35
  • (0)
  Add to cart