100% satisfaction guarantee Immediately available after payment Both online and in PDF No strings attached
logo-home
Supply Chain Data Analytics (SCDA) Summary plus formula sheet notes CA$10.72   Add to cart

Class notes

Supply Chain Data Analytics (SCDA) Summary plus formula sheet notes

 7 views  0 purchase
  • Course
  • Institution
  • Book

This document contains a profound overview of most course material relevant to the (resit) exam of Supply Chain Data Analytics (E_TSCM_SCDA), a course provided by Vrije Universiteit Amsterdam for the study MSc Transport & Supply Chain Management. The file covers lecture material, tutorial notes (r...

[Show more]
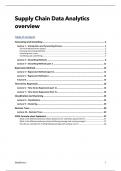
Preview 4 out of 50  pages

  • March 4, 2024
  • 50
  • 2022/2023
  • Class notes
  • Maryam karimi mamaghan
  • All classes
avatar-seller
Supply Chain Data Analytics
overview
Table of Contents
Forecasting and Smoothing ............................................................................................... 2
Lecture 1 – Introduction and Forecasting Process ....................................................................... 2
The Forecasting Process (steps) .................................................................................................................... 2
Choosing Forecasting Methods .................................................................................................................... 5
Visualizing time series ................................................................................................................................... 6
Overfitting and underfitting.......................................................................................................................... 7
Lecture 2 – Smoothing Methods ................................................................................................ 8
Lecture 3 – Smoothing Methods part 2 .................................................................................... 11
Regression Methods ........................................................................................................ 12
Lecture 4 – Regression Methods (part 1) .................................................................................. 12
Lecture 5 – Regression Methods 2 ............................................................................................ 15
Tutorial 3 ................................................................................................................................. 15
Time Series Regression..................................................................................................... 16
Lecture 6 – Time Series Regression (part 1) .............................................................................. 16
Lecture 7 – Time Series Regression (Part 2) .............................................................................. 18
Classification and Clustering ............................................................................................ 23
Lecture 8 – Classification .......................................................................................................... 23
Lecture 9 – Clustering............................................................................................................... 29
Decision Trees .................................................................................................................. 30
Lecture 10 – Decision Trees ...................................................................................................... 30
SCDA Formula sheet Explained......................................................................................... 37
What is the difference between Mean Absolute Error and Mean Squared Error? .................................... 37
What is the difference between Centered Moving average and moving average? ................................... 37
How do you calculate the Trailing Moving Average with window size w? ................................................. 38


MatthNotes 1

,Forecasting and Smoothing
Includes:
• Lecture 1 – Introduction and Forecasting Process
• Lecture 2 – Smoothing Methods (part 1)
• Lecture 3 – Smoothing Methods (part 2)


Lecture 1 – Introduction and Forecasting Process
Data Analytics – The process of exploring and analyzing large datasets to find hidden
patterns, trends, and possible correlations.
Goal: to extract value (insight) out of data and make decisions (improve decision making,
better customer service)

Steps:
1. Understanding the problem – understand, define goals, plan for a solution
2. Data collection – gather right data from various source
3. Data cleaning – make data ready for analysis by removing unwanted, redundant, and
missing values (one of the most time consuming)
4. Data exploration and analysis – using tools and techniques such as data visualization
and data mining to analyze data
5. Interpreting the results – to find hidden patterns, future trends, insights

Data Analytics Techniques
1. Forecasting
2. Regression
3. Time series
4. Classification
5. Machine learning
6. Clustering

The Forecasting Process (steps)
- Cross sectional data (prediction): type of data collected by observing many subjects
(such as individuals, firms, countries, or regions) at one point in time.
- Time series (forecasting): simply a series of data points ordered in time. In time
series, time is often the independent variable, and the goal is usually to make a
forecast for the future

What is the difference between prediction and forecasting?

Forecasting process steps
1. The forecasting goal
- How will the forecast be used by the organization?
- What type of forecasts are needed?
- Is it descriptive or predictive? To find seasonal patterns and trends in the current data
or to forecast future values
- Forecast horizon? Updating? How far into the future should we forecast, how often
can we update the forecast?
- Automated or manual?


MatthNotes 2

, 2. Getting data
- What type of data do we need?
- Data quality
- Single or multiple sources of data – combine from different sources for better results
- Temporal frequency of data
- Granularity of data – region
- *Domain expertise may help with this
3. Data exploring and visualization
- Goal: detect initial patterns and potential problems such as extreme or missing values
- View the data (Excel or R)
- Visualize the data
- Use your observations to pre-process and to choose forecasting methods


4. Pre-processing
- Why do we need to pre-process data? Possible reasons: missing values, obsolete or
redundant fields, unequally spaced series, values not consistent with policy or
common sense
- Handling missing data – Possibilities: ignore it, omit it, replace with some constant,
the mean, median or mode, or randomly generated values from the distribution,
impute the missing value based on other characteristics of the data.
When missing data, there are two possible forecasting: Naïve or Seasonal Naïve Forecasting
You may want to remove variables or records that do not help with the forecast, you could
remove unary variables or duplicate records.


5. Partition series
- It is done to avoid overfitting.
- Overfitting: performs well on the training data, but poor on the validation set. The
model is unable to generalize the data.


-
- Data partitioning:


MatthNotes 3

, i. Fit the models only to the training period
ii. Assess performance on the validation period
iii. Deploy the “best” model for future forecasts. Rerun the model on the
entire series; use the model to forecast the future
- Choosing a training validation period. How would you choose the length of the
training and validation period? Depends on forecasting goal

6. Apply Forecasting Methods
- What kind of forecasting method? Data-driven, model-based, or judgmental?
- How many different methods we are going to test?
- Are we going to combine methods?
- Data driven methods
i. Learn patterns from the data
ii. Requires less user input and are easily automated, but a large time
series is necessary for adequate learning
iii. Possible methods: smoothing methods
- Model-based methods
i. Use statistical, mathematical, or a scientific model to approximate a
time series
ii. Suitable for time series with limited data and can include external
information
iii. Possible methods: regression methods
- Judgmental methods
i. Incorporate intuitive judgment, opinions, and subjective probability
estimates
ii. Are used when there is a lack of good data, or to adjust statistical
forecast, or to compare and combine with statistical forecasts.
- Combining methods and ensembles
i. Combining multiple forecasts can improve predictive performance
1. Two-level forecast: method 1 generates initial forecasts,
method 2 uses the forecast errors from method 1 to forecast
future errors
2. Ensembles: apply multiple forecasting methods, average the
different forecasts, creating forecasts that are more robust and
of a higher precision.
7. Evaluate and compare performance
- Missing

8. Implement forecast/system


MatthNotes 4

The benefits of buying summaries with Stuvia:

Guaranteed quality through customer reviews

Guaranteed quality through customer reviews

Stuvia customers have reviewed more than 700,000 summaries. This how you know that you are buying the best documents.

Quick and easy check-out

Quick and easy check-out

You can quickly pay through credit card or Stuvia-credit for the summaries. There is no membership needed.

Focus on what matters

Focus on what matters

Your fellow students write the study notes themselves, which is why the documents are always reliable and up-to-date. This ensures you quickly get to the core!

Frequently asked questions

What do I get when I buy this document?

You get a PDF, available immediately after your purchase. The purchased document is accessible anytime, anywhere and indefinitely through your profile.

Satisfaction guarantee: how does it work?

Our satisfaction guarantee ensures that you always find a study document that suits you well. You fill out a form, and our customer service team takes care of the rest.

Who am I buying these notes from?

Stuvia is a marketplace, so you are not buying this document from us, but from seller mrhbout. Stuvia facilitates payment to the seller.

Will I be stuck with a subscription?

No, you only buy these notes for CA$10.72. You're not tied to anything after your purchase.

Can Stuvia be trusted?

4.6 stars on Google & Trustpilot (+1000 reviews)

77764 documents were sold in the last 30 days

Founded in 2010, the go-to place to buy study notes for 14 years now

Start selling
CA$10.72
  • (0)
  Add to cart