BTM 200 Assignment 2 complete dox Concordia University
Assignment 2
In this assignment, a couple of different tools to assess computer hardware will be used. These
different tools will be used to measure the performance of the computer currently in use.
Windows Tools
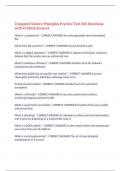
Windows offer different methods to measure a computer’s performance. With Windows 10,
you can go into your settings, then search for the setting “about your PC”. This setting will give
you basic information about your computer. Concerning CPU and memory usage (mainly RAM),
my computer has an Intel® Core™ i7-6500U CPU with a speed of 2.50 GHz and two cores. The
random access memory of this computer is a DDR3 and it has 16 GB installed. Windows offer a
task manager in which you can see the usage of your CPU as well as your RAM. For my CPU,
utilization is usually around 2% to 5% for a typical school day with a speed between 1 GHz and
1.30 GHz. For a typical school day, the memory used with this computer is around 6 GB with
around 3.5 GB on standby, which leaves 6.5 GB free.
PassMark’s PerformanceTest
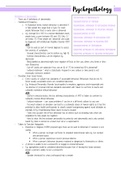
This test evaluates your CPU, your 2D graphics, your 3D graphics, it performs a disk test and it
tests your computer’s memory. If you do a complete test, the results will show you how fast
your computer is based on a formula and it will also provide the percentile in which your
computer is to be able to compare it to others. My total rating was 2659.7, which puts my
computer in the 63rd percentile. It is also possible to see the mark and the percentile of the
individual components, like CPU or memory, for example.
Primate Lab’s Geekbench
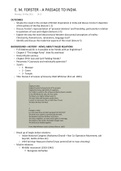
This program gives you some system information, like what type of motherboard you have,
what type of memory, CPU and more. The program allows two tests to be performed, the first
one is to evaluate the performance of your CPU while the second one evaluates the
performance of your GPU. When you evaluate either your CPU or your GPU, the program will
give you a score based on a score of 4000, the score of an Intel Core i7-6600U with 2.60 GHz, as
we can see on their website. Which means that if your score is higher than 4000, then your CPU
or GPU is higher and the opposite goes as well. You can also look at the score of every specific
thing that was evaluated. The score that this computer got for a single core is 3657 and for the
dual cores is 7037. For the GPU, the score was 18233.
Maxon’s Cinebench
This program also evaluates your CPU and GPU. For the CPU, it uses your computer’s
capabilities to render a scene, which is stationary, while for the GPU, it does the same to
produce the 3D scene of a car chase. Then it gives a score based on your computer’s
performance. You then obtain a score, and you can compare it to other computers. For the
GPU, this computer did the scene with 75.05 fps, frames per second. The CPU obtained a score
of 322 points.
Assignment 2
In this assignment, a couple of different tools to assess computer hardware will be used. These
different tools will be used to measure the performance of the computer currently in use.
Windows Tools
Windows offer different methods to measure a computer’s performance. With Windows 10,
you can go into your settings, then search for the setting “about your PC”. This setting will give
you basic information about your computer. Concerning CPU and memory usage (mainly RAM),
my computer has an Intel® Core™ i7-6500U CPU with a speed of 2.50 GHz and two cores. The
random access memory of this computer is a DDR3 and it has 16 GB installed. Windows offer a
task manager in which you can see the usage of your CPU as well as your RAM. For my CPU,
utilization is usually around 2% to 5% for a typical school day with a speed between 1 GHz and
1.30 GHz. For a typical school day, the memory used with this computer is around 6 GB with
around 3.5 GB on standby, which leaves 6.5 GB free.
PassMark’s PerformanceTest
This test evaluates your CPU, your 2D graphics, your 3D graphics, it performs a disk test and it
tests your computer’s memory. If you do a complete test, the results will show you how fast
your computer is based on a formula and it will also provide the percentile in which your
computer is to be able to compare it to others. My total rating was 2659.7, which puts my
computer in the 63rd percentile. It is also possible to see the mark and the percentile of the
individual components, like CPU or memory, for example.
Primate Lab’s Geekbench
This program gives you some system information, like what type of motherboard you have,
what type of memory, CPU and more. The program allows two tests to be performed, the first
one is to evaluate the performance of your CPU while the second one evaluates the
performance of your GPU. When you evaluate either your CPU or your GPU, the program will
give you a score based on a score of 4000, the score of an Intel Core i7-6600U with 2.60 GHz, as
we can see on their website. Which means that if your score is higher than 4000, then your CPU
or GPU is higher and the opposite goes as well. You can also look at the score of every specific
thing that was evaluated. The score that this computer got for a single core is 3657 and for the
dual cores is 7037. For the GPU, the score was 18233.
Maxon’s Cinebench
This program also evaluates your CPU and GPU. For the CPU, it uses your computer’s
capabilities to render a scene, which is stationary, while for the GPU, it does the same to
produce the 3D scene of a car chase. Then it gives a score based on your computer’s
performance. You then obtain a score, and you can compare it to other computers. For the
GPU, this computer did the scene with 75.05 fps, frames per second. The CPU obtained a score
of 322 points.