100% satisfaction guarantee Immediately available after payment Both online and in PDF No strings attached
logo-home
Associate Big Data Analyst (ABDA) Practice Exam CA$101.37   Add to cart

Exam (elaborations)

Associate Big Data Analyst (ABDA) Practice Exam

 1 view  0 purchase
  • Course
  • Computers
  • Institution
  • Computers

This practice exam is designed for candidates aiming to become certified Associate Big Data Analysts (ABDA). The exam covers big data concepts, including data collection, storage, analysis, and visualization techniques. Topics include Hadoop, Spark, data mining, and machine learning algorithms. Can...

[Show more]
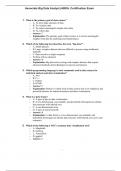
Preview 4 out of 99  pages

  • October 7, 2024
  • 99
  • 2024/2025
  • Exam (elaborations)
  • Questions & answers
  • Computers
  • Computers
avatar-seller
Associate Big Data Analyst (ABDA. Certification Exam


1. What is the primary goal of data science?
o A. To store large amounts of data
o B. To visualize data
o C. To extract meaningful insights from data
o D. To collect data
o Answer: C
o Explanation: The primary goal of data science is to extract meaningful
insights from data by analyzing and interpreting it.

2. Which of the following best describes the term "big data"?
o A. Small datasets
o B. Large, complex datasets that are difficult to process using traditional
methods
o C. Data stored in a single computer
o D. Data with no structure
o Answer: B
o Explanation: Big data refers to large and complex datasets that require
advanced methods and technologies to process and analyze.

3. Which programming language is most commonly used in data science for
statistical analysis and data visualization?
o A. Java
o B. C++
o C. Python
o D. HTML
o Answer: C
o Explanation: Python is widely used in data science due to its simplicity and
powerful libraries for statistical analysis and data visualization.

4. What is a data frame?
o A. A type of plot in data visualization
o B. A two-dimensional, size-mutable, and potentially heterogeneous tabular
data structure with labeled axes
o C. A one-dimensional array
o D. A type of neural network
o Answer: B
o Explanation: A data frame is a two-dimensional, size-mutable, and
potentially heterogeneous tabular data structure with labeled axes (rows and
columns).

5. Which of the following is NOT a common data visualization tool?
o A. Matplotlib
o B. Seaborn
o C. TensorFlow
o D. ggplot2
o Answer: C


1

, Associate Big Data Analyst (ABDA. Certification Exam


o Explanation: TensorFlow is a library for machine learning, not data
visualization. Matplotlib, Seaborn, and ggplot2 are popular data visualization
tools.

6. What does the term "EDA" stand for in data science?
o A. Exploratory Data Analysis
o B. Effective Data Analytics
o C. Efficient Data Assessment
o D. Early Data Aggregation
o Answer: A
o Explanation: EDA stands for Exploratory Data Analysis, which involves
summarizing the main characteristics of a dataset, often using visual methods.

7. What is the purpose of a correlation matrix?
o A. To visualize the distribution of data
o B. To summarize the relationships between multiple variables
o C. To clean the dataset
o D. To perform predictive analysis
o Answer: B
o Explanation: A correlation matrix summarizes the relationships between
multiple variables by showing the correlation coefficients between them.

8. Which machine learning algorithm is used for classification tasks?
o A. Linear Regression
o B. K-Nearest Neighbors
o C. Principal Component Analysis
o D. K-Means Clustering
o Answer: B
o Explanation: K-Nearest Neighbors (KNN) is a simple, instance-based
learning algorithm used for classification tasks.

9. In the context of machine learning, what does "overfitting" mean?
o A. The model performs well on training data but poorly on new, unseen data
o B. The model performs poorly on both training and test data
o C. The model performs well on test data but poorly on training data
o D. The model does not fit the training data at all
o Answer: A
o Explanation: Overfitting occurs when a model is too complex and performs
well on training data but poorly on new, unseen data.

10. Which of the following techniques is used to handle missing data?
o A. Removing rows with missing values
o B. Imputing missing values with the mean or median
o C. Predicting missing values using a model
o D. All of the above
o Answer: D
o Explanation: Handling missing data can involve removing rows with missing
values, imputing missing values with the mean or median, or predicting
missing values using a model.

2

, Associate Big Data Analyst (ABDA. Certification Exam


11. What is a histogram used for?
o A. To display the frequency distribution of a set of continuous data
o B. To show the relationship between two variables
o C. To compare different categories
o D. To perform predictive analysis
o Answer: A
o Explanation: A histogram is used to display the frequency distribution of a
set of continuous data.

12. Which of the following is a measure of central tendency?
o A. Mean
o B. Standard deviation
o C. Variance
o D. Range
o Answer: A
o Explanation: The mean is a measure of central tendency, indicating the
average value of a dataset.

13. What is the purpose of data normalization?
o A. To reduce data redundancy
o B. To scale data to a standard range
o C. To visualize data
o D. To store data efficiently
o Answer: B
o Explanation: Data normalization scales data to a standard range, which helps
in improving the performance of machine learning algorithms.

14. Which of the following is an example of unstructured data?
o A. A spreadsheet
o B. A text document
o C. A database table
o D. A CSV file
o Answer: B
o Explanation: Unstructured data does not have a predefined format or
organization, such as text documents, images, and videos.

15. What is the purpose of the K-Means clustering algorithm?
o A. To classify data into predefined categories
o B. To predict future data points
o C. To group similar data points into clusters
o D. To reduce dimensionality of the data
o Answer: C
o Explanation: K-Means clustering is an unsupervised learning algorithm used
to group similar data points into clusters.

16. Which type of plot is used to show the relationship between two continuous
variables?
o A. Bar plot


3

, Associate Big Data Analyst (ABDA. Certification Exam


o B. Histogram
o C. Scatter plot
o D. Box plot
o Answer: C
o Explanation: A scatter plot is used to show the relationship between two
continuous variables by displaying data points on a two-dimensional graph.

17. What does "PCA" stand for in data science?
o A. Primary Component Analysis
o B. Principal Component Analysis
o C. Principal Correlation Analysis
o D. Primary Correlation Analysis
o Answer: B
o Explanation: PCA stands for Principal Component Analysis, a technique
used to reduce the dimensionality of a dataset.

18. What is the purpose of a confusion matrix in machine learning?
o A. To visualize the distribution of data
o B. To evaluate the performance of a classification model
o C. To handle missing data
o D. To perform clustering
o Answer: B
o Explanation: A confusion matrix is used to evaluate the performance of a
classification model by showing the counts of true positive, true negative,
false positive, and false negative predictions.

19. Which of the following is a supervised learning algorithm?
o A. K-Means clustering
o B. Principal Component Analysis
o C. Linear Regression
o D. DBSCAN
o Answer: C
o Explanation: Linear regression is a supervised learning algorithm used for
predicting continuous values.

20. Which statistical measure indicates the spread of data around the mean?
o A. Mean
o B. Median
o C. Standard deviation
o D. Mode
o Answer: C
o Explanation: The standard deviation measures the spread of data around the
mean, indicating how much the data varies from the average.

21. Which of the following is an example of a categorical variable?
o A. Age
o B. Salary
o C. Gender
o D. Height


4

The benefits of buying summaries with Stuvia:

Guaranteed quality through customer reviews

Guaranteed quality through customer reviews

Stuvia customers have reviewed more than 700,000 summaries. This how you know that you are buying the best documents.

Quick and easy check-out

Quick and easy check-out

You can quickly pay through credit card or Stuvia-credit for the summaries. There is no membership needed.

Focus on what matters

Focus on what matters

Your fellow students write the study notes themselves, which is why the documents are always reliable and up-to-date. This ensures you quickly get to the core!

Frequently asked questions

What do I get when I buy this document?

You get a PDF, available immediately after your purchase. The purchased document is accessible anytime, anywhere and indefinitely through your profile.

Satisfaction guarantee: how does it work?

Our satisfaction guarantee ensures that you always find a study document that suits you well. You fill out a form, and our customer service team takes care of the rest.

Who am I buying these notes from?

Stuvia is a marketplace, so you are not buying this document from us, but from seller nikhiljain22. Stuvia facilitates payment to the seller.

Will I be stuck with a subscription?

No, you only buy these notes for CA$101.37. You're not tied to anything after your purchase.

Can Stuvia be trusted?

4.6 stars on Google & Trustpilot (+1000 reviews)

75759 documents were sold in the last 30 days

Founded in 2010, the go-to place to buy study notes for 14 years now

Start selling
CA$101.37
  • (0)
  Add to cart