Independent anova - Study guides, Class notes & Summaries
Looking for the best study guides, study notes and summaries about Independent anova? On this page you'll find 795 study documents about Independent anova.
Page 2 out of 795 results
Sort by
-
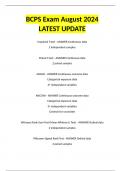
BCPS Exam August 2024 LATEST UPDATE
- Exam (elaborations) • 88 pages • 2024
- CA$18.18
- + learn more
Unpaired T-test - ANSWER Continuous data 2 independent samples Paired T-test - ANSWER Continuous data 2 paired samples ANOVA - ANSWER Continuous outcome data Categorical exposure data 3+ independent variables
-
Solution Manual for Statistics for Nursing Research A Workbook for Evidence-Based Practice 3rd Edition Susan Grove Daisha
- Exam (elaborations) • 75 pages • 2024
- CA$25.18
- + learn more
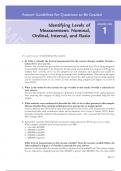
Part 1: Understanding Statistical Methods 1. Identifying Levels of Measurement: Nominal, Ordinal, Interval, and Ratio 2. Identifying Probability and Nonprobability Sampling Methods in Studies 3. Understanding the Sampling Section of a Research Report: Population, Sampling Criteria, Sample Size, Refusal Rate, and Attrition Rate 4. Understanding Reliability of Measurement Methods 5. Understanding Validity of Measurement Methods 6. Understanding Frequencies and Percentages 7. Interpreting Line Gra...
-
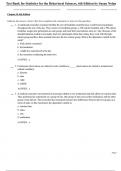
Test Bank for Statistics for the Behavioral Sciences, 6th Edition by Susan Nolan
- Exam (elaborations) • 624 pages • 2024
- CA$55.27
- + learn more
Test Bank for Statistics for the Behavioral Sciences, 6e 6th Edition by Susan Nolan, Kelly M. Goedert. Complete Chapters (Chap 1 to 18) test bank are included with answers. Chapter 1 An Introduction to Statistics and Research Design Chapter 2 Frequency Distributions Chapter 3 Visual Displays of Data Chapter 4 Central Tendency and Variability Chapter 5 Sampling and Probability Chapter 6 The Normal Curve, Standardization, and z Scores Chapter 7 Hypothesis Testing with z Tests Chapter 8 C...
-
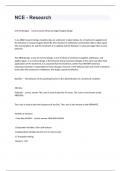
NCE - Research questions with complete solutions graded A+
- Exam (elaborations) • 30 pages • 2024
- CA$27.98
- + learn more
NCE - ResearchA-B-A-B Designs - correct answer Reversal Single-Subject Design In an ABAB research design, baseline data on a behavior is taken (phase A), a treatment is applied and the behavior is measured again (phase B), the treatment is withdrawn and baseline data is taken again (the second phase A), and the treatment is re-applied and the behavior is measured again (the second phase B). The ABAB design, a type of reversal design, is one in which a treatment is applied, withdrawn, and...
-
Biostatistics Final Exam Definitions UTA 100% Correct
- Exam (elaborations) • 21 pages • 2024
- CA$13.98
- + learn more
Biostatistics Final Exam Definitions UTA 100% Correct Bonferroni-Holm Multiple Comparisons -In the context of an ANOVA, rejecting the null hypothesis means there is a statistical difference between at least two means, but it won't tell you where it is. You use this to discover exactly which means are different. -Only used for Model I ANOVAs -A t-statistic for a two sample t-test assuming equal variance Steps to Applying the Bonferroni-Holm Multiple Comparison Test Step 1: Calculate...

As you read this, a fellow student has made another $4.70

-
Test Bank for Introduction to Statistics and Data Analysis, 7th Edition by Roxy Peck
- Exam (elaborations) • 418 pages • 2024
- CA$41.28
- + learn more
Test Bank for Introduction to Statistics and Data Analysis, 7e 7th Edition by Roxy Peck, Chris Olsen. Complete Chapters (Chap 1- 16) are included with answers. 1. THE ROLE OF STATISTICS AND THE DATA ANALYSIS PROCESS: Why Study Statistics? The Nature and Role of Variability. Statistics and the Data Analysis Process. Types of Data and Some Simple Graphical Displays. 2. COLLECTING DATA SENSIBLY: Statistical Studies: Observation and Experimentation. Sampling. Simple Comparative Experiments. More...
-
WGU Statistics Test Questions and Answers Top Graded 2024
- Exam (elaborations) • 21 pages • 2024
- CA$17.48
- + learn more
In a standard 52-card deck, where each card is assigned a numeric value, the mean of the 52 cards is 7.0 with a standard deviation of 3.742. To test if a representative sample can be attained, the deck is shuffled and 13 cards are randomly drawn, one at a time. Each card is recorded and then returned randomly to the deck before the next card is drawn. This process of drawing 13 random cards is repeated a total of 20 times, and the mean and standard deviation of each round is computed. Which...
-
Test Bank for The Analysis of Biological Data, 3rd Edition by Michael C. Whitlock
- Exam (elaborations) • 361 pages • 2022
- CA$55.97
- 13x sold
- + learn more
Test Bank for The Analysis of Biological Data 3e 3rd Edition by Michael C. Whitlock, Dolph Schluter ISBN-13: 4433 PART 1 INTRODUCTION TO STATISTICS 1.0 Statistics and samples 1.1 What is statistics? 1.2 Sampling populations 1.3 Types of data and variables 1.4 Frequency distributions and probability distributions 1.5 Types of studies 1.6 Summary Interleaf 1 Correlation does not require causation 2.0 Displaying data 2.1 Guidelines for effective graphs 2.2 Showing data for one va...
-
WGU Statistics Test 100% Solved 2024
- Exam (elaborations) • 39 pages • 2024
- CA$18.88
- + learn more
WGU Statistics Test 100% Solved 2024 In a standard 52-card deck, where each card is assigned a numeric value, the mean of the 52 cards is 7.0 with a standard deviation of 3.742. To test if a representative sample can be attained, the deck is shuffled and 13 cards are randomly drawn, one at a time. Each card is recorded and then returned randomly to the deck before the next card is drawn. This process of drawing 13 random cards is repeated a total of 20 times, and the mean and standard devi...
