Unit 2 Outcome B Sa
Investigation to explore the cooling rate of stearic acid and
determine the melting point
Introduction
The purpose of this experiment is to observe the cooling rate of stearic acid and see how quickly the
acid cooled, whilst also determining the point it starts to melt.
The stearic acid at the start of the experiment will be a solid which means it has a fixed shape and
volume. It is bonded together by strong intermolecular forces meaning it also has relatively low average
molecular kinetic energy. As the experiment takes place we add thermal energy so the stearic acid
begins to melt into a liquid and fusion takes place. Its properties will now have changed. It will still have
a fixed shape and volume, but the intermolecular forces will become slightly weaker with moderate
average molecular kinetic energy. At boiling point, the liquid vaporises into a gas. It will now have a fluid
shape and can expand to fit a container. It will be bonded together by weak intermolecular forces and
will have high average molecular kinetic energy.
As thermal energy is added to the system, it causes a state change which increases the kinetic energy of
the molecules, as explained above from when it changes from a solid to a liquid and then into a gas
Calibrating thermometer
Thermometers measure temperature. In order to ensure accuracy while carrying out the experiment,
we needed to calibrate both the digital and fluid-filled thermometers. This was done by measuring the
temperatures in a cold and hot environment.
Firstly, for the cold, a beaker was filled with ice. Then the digital thermometer was placed inside the
beaker making sure it did not touch the sides so as to not jeopardise the reading. It was then left to
stabilize for a minute and thereafter the temperature was recorded. This was done three times. This
method was then repeated for the fluid-filled thermometer.
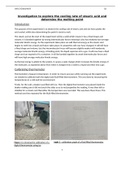
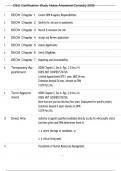
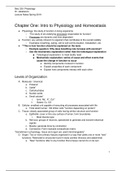
Figure 1 is showing the calibration of a Graph 1 - calibration graph of a fluid filled thermometer
digital thermometer using ice
1
, Unit 2 Outcome B Sa
Then for the hot, a beaker was half-filled with water and heated to boiling using a Bunsen burner. The
digital thermometer was then placed in the beaker three different times and the temperature was
recorded again. The same was done with the fluid-filled thermometer.
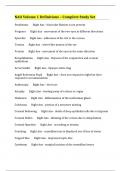
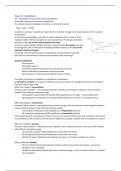
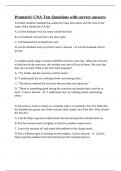
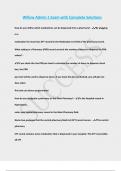
Figure 2 showing calibration of a fluid Graph 2 – calibration graph of digital thermometer
filled thermometer in boiling water
Measured Temperature (Digital) ⁰C Measured Temperature (fluid-filled)
⁰C
1 2 3 Mean 1 2 3 4
Freezin 0.3 0.4 0.4 0.37 0 0 1 0.3
g 0C
Boiling 104.5 101.6 101.3 102.47 102 103 103 102.7
100C
Table 1 showing the results from calibration of the thermometers
Both thermometers were accurate, however the digital thermometer was more precise as it gave
readings to one decimal place rather than 1 degree Celsius like the fluid filled.
Cooling curve experiment for stearic acid
Before we began the experiment, the safety rules were covered. This included wearing PPE such as a lab
coat, eye protection, gloves, no running in the lab, no food or drink to be consumed in the lab, long hair
must be tied back, in the event of a spill or accidental exposure the teacher must be informed
immediately. We were also given a briefing on the dangers of stearic acid and how it can cause skin
irritation, eye damage, respiratory problems if inhaled and what to do in those cases (wash skin and
2
Investigation to explore the cooling rate of stearic acid and
determine the melting point
Introduction
The purpose of this experiment is to observe the cooling rate of stearic acid and see how quickly the
acid cooled, whilst also determining the point it starts to melt.
The stearic acid at the start of the experiment will be a solid which means it has a fixed shape and
volume. It is bonded together by strong intermolecular forces meaning it also has relatively low average
molecular kinetic energy. As the experiment takes place we add thermal energy so the stearic acid
begins to melt into a liquid and fusion takes place. Its properties will now have changed. It will still have
a fixed shape and volume, but the intermolecular forces will become slightly weaker with moderate
average molecular kinetic energy. At boiling point, the liquid vaporises into a gas. It will now have a fluid
shape and can expand to fit a container. It will be bonded together by weak intermolecular forces and
will have high average molecular kinetic energy.
As thermal energy is added to the system, it causes a state change which increases the kinetic energy of
the molecules, as explained above from when it changes from a solid to a liquid and then into a gas
Calibrating thermometer
Thermometers measure temperature. In order to ensure accuracy while carrying out the experiment,
we needed to calibrate both the digital and fluid-filled thermometers. This was done by measuring the
temperatures in a cold and hot environment.
Firstly, for the cold, a beaker was filled with ice. Then the digital thermometer was placed inside the
beaker making sure it did not touch the sides so as to not jeopardise the reading. It was then left to
stabilize for a minute and thereafter the temperature was recorded. This was done three times. This
method was then repeated for the fluid-filled thermometer.
Figure 1 is showing the calibration of a Graph 1 - calibration graph of a fluid filled thermometer
digital thermometer using ice
1
, Unit 2 Outcome B Sa
Then for the hot, a beaker was half-filled with water and heated to boiling using a Bunsen burner. The
digital thermometer was then placed in the beaker three different times and the temperature was
recorded again. The same was done with the fluid-filled thermometer.
Figure 2 showing calibration of a fluid Graph 2 – calibration graph of digital thermometer
filled thermometer in boiling water
Measured Temperature (Digital) ⁰C Measured Temperature (fluid-filled)
⁰C
1 2 3 Mean 1 2 3 4
Freezin 0.3 0.4 0.4 0.37 0 0 1 0.3
g 0C
Boiling 104.5 101.6 101.3 102.47 102 103 103 102.7
100C
Table 1 showing the results from calibration of the thermometers
Both thermometers were accurate, however the digital thermometer was more precise as it gave
readings to one decimal place rather than 1 degree Celsius like the fluid filled.
Cooling curve experiment for stearic acid
Before we began the experiment, the safety rules were covered. This included wearing PPE such as a lab
coat, eye protection, gloves, no running in the lab, no food or drink to be consumed in the lab, long hair
must be tied back, in the event of a spill or accidental exposure the teacher must be informed
immediately. We were also given a briefing on the dangers of stearic acid and how it can cause skin
irritation, eye damage, respiratory problems if inhaled and what to do in those cases (wash skin and
2