100% satisfaction guarantee Immediately available after payment Both online and in PDF No strings attached
logo-home
WGU C784 Applied Healthcare Statistics Module 5 Questions and Answers (2023 Update) £7.85   Add to cart

Exam (elaborations)

WGU C784 Applied Healthcare Statistics Module 5 Questions and Answers (2023 Update)

1 review
 19 views  0 purchase
  • Module
  • Institution

WGU C784 Applied Healthcare Statistics Module 5 Questions & Answers 2023 Update When one variable causes change in another, we call the first variable the ___________________ variable*. The affected variable is called the _______________ variable*. - (answer)When one variable causes change ...

[Show more]
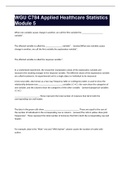
Preview 2 out of 12  pages

  • February 19, 2023
  • 12
  • 2022/2023
  • Exam (elaborations)
  • Unknown

1  review

review-writer-avatar

By: alishavasey5150 • 9 months ago

For sure

avatar-seller
WGU C784 Applied Healthcare Statistics
Module 5
When one variable causes change in another, we call the first variable the ___________________
variable*.


The affected variable is called the _______________ variable*. - (answer)When one variable causes
change in another, we call the first variable the explanatory variable*.


The affected variable is called the response variable*.


In a randomized experiment, the researcher manipulates values of the explanatory variable and
measures the resulting changes in the response variable. The different values of the explanatory variable
are called treatments. An experimental unit is a single object or individual to be measured.

A two-way table, also known as a two-way frequency table or contingency table, is used to show the
relationship between two ______________________variables ( C→C ); the rows show the categories of
one variable, and the columns show the categories of the other variable. - (answer)categorical variables
( C→C )

______________________. These represent the total number of instances that fall in both the
corresponding row and header.


The data in the green cells show _______________________________. These are equal to the sum of
the number of individuals in the corresponding row or column. - (answer)The cells in yellow show joint
frequencies*. These represent the total number of instances that fall in both the corresponding row and
header.


For example, data in the "Male" row and "With Autism" column counts the number of males with
autism.

, The data in the green cells show marginal frequencies*. These are equal to the sum of the number of
individuals in the corresponding row or column. For example, data in the "Totals" column and "Female"
row shows the total number of females in the study. It may be helpful to remember that marginal
frequencies appear in the margins of the table.


The bottom, right cell (in both the "Totals" column and the "Totals" row) measures the total number of
individuals in the study.

The relationship between two variables that are both quantitative can be displayed in a
__________________________. - (answer)scatterplot;

As we've seen earlier, every point on a coordinate plane can be represented by an ordered pair*, ( x , y ).
Here, the x -value is typically the _________________variable's value for a piece of data, and the y -
value is the corresponding value for the ________________________variable. A simple way to
remember this fact is that the term "explanatory" has an " x " in it. - (answer)explanatory variable;
response variable

Side-by-side box plots are a good choice for two-variable data where the explanatory variable is
____________ data and the response variable is ____________ data. - (answer)Categorical


Quantitative

Which variable, explanatory or response, is displayed on the x -axis on side-by-side boxplots? -
(answer)Side-by-side boxplots can be horizontal or vertical, so either variable (explanatory or response)
can be displayed on the x -axis.

A scatterplot is a good choice to display two-variable data that are both __________ variables. -
(answer)Quantitative

The relationship between the x -variable and the y -variable is called _____________. -
(answer)Correlation

What determines the location of a dot on a scatterplot? - (answer)A dot is placed on a scatterplot
according to its

x - and y -value.

When analyzing a possible relationship for two-variable data, if both variables are categorical, what is
the most appropriate choice to display the data?


a) Side-by-side boxplots

The benefits of buying summaries with Stuvia:

Guaranteed quality through customer reviews

Guaranteed quality through customer reviews

Stuvia customers have reviewed more than 700,000 summaries. This how you know that you are buying the best documents.

Quick and easy check-out

Quick and easy check-out

You can quickly pay through credit card for the summaries. There is no membership needed.

Focus on what matters

Focus on what matters

Your fellow students write the study notes themselves, which is why the documents are always reliable and up-to-date. This ensures you quickly get to the core!

Frequently asked questions

What do I get when I buy this document?

You get a PDF, available immediately after your purchase. The purchased document is accessible anytime, anywhere and indefinitely through your profile.

Satisfaction guarantee: how does it work?

Our satisfaction guarantee ensures that you always find a study document that suits you well. You fill out a form, and our customer service team takes care of the rest.

Who am I buying these notes from?

Stuvia is a marketplace, so you are not buying this document from us, but from seller DrLabrea. Stuvia facilitates payment to the seller.

Will I be stuck with a subscription?

No, you only buy these notes for £7.85. You're not tied to anything after your purchase.

Can Stuvia be trusted?

4.6 stars on Google & Trustpilot (+1000 reviews)

80467 documents were sold in the last 30 days

Founded in 2010, the go-to place to buy revision notes and other study material for 14 years now

Start selling
£7.85
  • (1)
  Add to cart