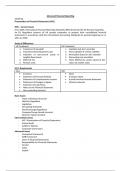
Advanced Financial Reporting
26/09/22
Presentation of Financial Statements (IAS1)
IFRS – Current Issues
From 2005, International Financial Reporting Standards (IFRS) dominate the UK financial reporting.
An EU Regulation requires all UK quoted companies to prepare their consolidated financial
statements in accordance with the International Accounting Standards for periods beginning on or
after Jan 2005.
Areas of Differences
UK Treatment IAS Treatment
1. Treatment of Goodwill 1. Capitalise but don’t amortise
2. Treatment of Development costs 2. Must capitalise if criteria satisfied
3. Valuation of non-current assets or 3. Revaluation based on fair valuation
tangible fixed assets 4. Discounting not permitted
4. Deferred Tax 5. Many differences: assets valued at fair
5. Pension costs value not market value
IAS 1 Requirement
New Old
Inventory Stock
Statement of Financial Position A balance sheet
Statement of Comprehensive Income A profit and loss/income statement
Statement of Changes in Equity Minority interests
Statement of Cash Flows
Notes to the Financial Statement
Non-controlling interests
Basic Issues
- Types of Business Structure
- Need for Regulation
- Legislation
- Accounting Standards
- Stock Exchange Regulations
- Company/Group Annual Accounts
- Directors’ Report Content
Intermediate Issues
- IAS 1 Presentation of Financial Statements
- Annual Audit
- Auditor’s Opinion
- Corporate Governance
Advanced Issues
- Conceptual Framework
- IASB Framework
- Users of Financial Statements
- Responsibility for Financial Statements
- Income
- Value
- Capital
,Types of Business Structure
Incorporated
- Ltd
- PLC
Unincorporated
- Sole trader
- Partnership
Regulatory Framework:
Legislation
Companies Act 2006:
- Record-keeping obligations
- Prepare annual accounts for each financial year
- Accounts must show a ‘true and fair’ view
- Accounts must be accompanied by a directors’ report
Accounting Standards
International Accounting Standards Board (IASB):
- International Financial Reporting Standards (IFRS)
- Formerly International Accounting Standards (IAS)
Stock Exchange Regulations
Content of Directors’ Report
Principle activities of the company, and any changes
Business review of the activities during the year
Future developments
Research and development activities
Post-balance sheet events
Value of land and buildings
Roles
- The Directors: responsible for the preparation and fair presentation of financial statements
in accordance with the IFRS
- The Accountants: prepare the entity’s accounts and ensure compliance with the appropriate
rules and standards
- The Auditor: ‘true and fair’ view
Users of Financial Statements
Investors, Lenders, Suppliers, Employees, Customers, Government, and Public
Group accounts – consolidated account. Financial account for several companies.
Deferred tax is due to difference between the depreciation and capital allowance.
Use Equity Shares instead of Ordinary Shares (own the business).
Revaluation Reserve – money that is being reserved for other purposes.
Current Assets lists, less liquid to more liquid:
Inventory
Trade Receivables
Prepayments
Bank
Cash
, 03/10/22
Financial Performance Analysis
Methods of Financial Statement Analysis
Horizontal Analysis
Vertical Analysis
Common-size Statements
Trend Percentages
Ratio Analysis
Cross-Sectional Analysis
Comparison with other companies in the same industry for the same year (differences in company
characteristics should always be accounted for in interpretation) and comparison with industry
averages (multi-product companies, definition and size of industry groupings).
Horizontal analysis uses comparative financial statements to calculate pound or percentage changes
in a financial statement item from one period to the next.
Vertical analysis (common size), where for a single financial statement, each item is expressed as a
percentage of a significant total e.g. all income statement items are expressed as % of sales.
In a common-size balance sheet (figure 1), each component is
expressed as a percentage of total assets.
In a common-size income statement (figure 2), each item is
expressed as a percentage of sales.
Advantages include:
- Allows comparison of companies of different size
- Allows internal structural analysis of the financial statements
of a company (relative magnitude of asset, liability, equity and
income statement components)
- Combination of horizontal and vertical analysis
Published Common size
€m %
Trend percentages show changes over time in given financial Sales
Cost of sales
5,356
(2,601)
100
(48.6)
statement items. Distribution costs
2,755
(382)
51.4
(7.1)
Administrative expenses (874) (16.3)
Ratio analysis is the expression of logical relationships between items Profit before interest and tax
Interest
1,499
(362)
28.0
(6.8)
in a financial statement of a single period. Profit before taxation
Taxation
1,137
(384)
21.2
(7.1)
Net profit for the period 753 14.1
From figure 1:
You can observe that fixed assets make up 22.4% of all assets. Bank is 22.4% of all assets, whereas
receivables makes up 43% of all assets – immediately can observe business is non-liquid.
Short-term borrowing makes up 39.6%, which is greater than current available liquid bank (22.4%).
From Figure 2:
Can observe that CoS is 48.6% - for every £1 you receive, you receive £0.5 in profit.
Can observe that administration costs are too high, can decrease admin costs to increase profit.
Can draw observations from common-size statements without need for analysis ratios.
CLOVER CORPORATION
Comparative Balance Sheets
Pound Change = Current Year Figure – Base Year Figure December 31, 2018 and 2017
Increase (Decrease)
Percentage Change = Pound Change/Base Year Figure * 100%
2018 2017 Amount %
Assets £ £
Land 40,000 40,000 0 0
e.g. 2017 property was 160,000 and 2018 was 125,0000 Buildings and equipment, net
Total property and equipment
120,000
160,000
85,000
125,000
35,000
35,000
41
28
therefore, %Change = [160,000 – 125,000]/125,000 * 100 = 28% Current assets:
Cash 12,000 23,500 (11,500) -49
Accounts receivable, net 60,000 40,000 20,000 50
Inventory 80,000 100,000 (20,000) -20
Prepaid expenses 3,000 1,200 1,800 150
Total current assets 155,000 164,700 (9,700) -6
Total assets 315,000 289,700 25,300 9