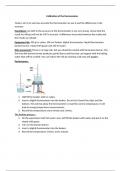
Calibration of the thermometer
Today’s aim is to see how accurate the thermometer we use is and the differences in the
accuracy.
Hypothesis: my faith in the accuracy of the thermometer is not very strong, I know that the
result we will get will not be 100 % accurate. A difference must exist between the reality and
the results we will get.
Equipment list: 400 g ice cubes, 500 cm3 beaker, digital thermometer, liquid thermometer,
bunsen burner, tripod with gauze and 250 ml water.
Risk assessment: There is no huge risk, but you should be careful with the bunsen burner. The
fire from the bunsen burner produces painful burns and that also can happen with the boiling
water that will be created. You can reduce the risk by wearing a lab coat and goggles.
Performance:
1. Half fill the beaker with ice cubes.
2. Insert a digital thermometer into the beaker. Do not let it touch the sides and the
bottom. This will not allow the thermometer to read the correct temperature, it will
lead to wrong temperature measurements.
3. Record the temperature every minute and 3 times.
The heating process :
1. Do the experiment with hot water now, half fill the beaker with water and put it on the
tripod with gauze.
2. Turn on the bunsen burner
3. Insert a digital thermometer into the beaker.
4. Record the temperature 3 times, every minute.
,Results :
Thermometer Temperature (℃)
1 2 3 Average
Boiling Water Digital 92.9 91.8 91.4 92.03
Liquid 96 96 97 96.3
Ice Digital 2.0 1.6 1.3 1.63
Liquid 5 3 4 4
Using the table I could draw a graph which has its Ice point at the point (4, 1.63) and the boiling
point at ( 96.3, 92,03). As you can see in the picture the graph is straight and proportional. The
x-axis is the digital thermometer and the y-axis is for the liquid thermometer. The calibration
curve is a straight rising curve, which means that the gradient is the same the whole way up.
The digital thermometer temperature is proportional with the liquid temperature. Proportional
relationships have the formula : y = kx and k is the rate and is always constant in proportional
graphs. To calculate the gradient I chose points on the graph that were easy to read. After that I
calculated the gradient with the equation: (m = difference in y / difference in x) This led to a
, result of 1,02 celsius/ min for the graph's rate, because it’s the constant in this experiment. The
calculation is next to the graph in the picture above.
I worked safely and nothing unexpected happened. We helped each other and were careful.
There were some risks, but if you work safely nothing unexpected will happen. The beakers
were of glass, which is hard and can hurt if it breaks. If it e.g. accidentally falls from you, it will
break into small sharp parts that can cause deep wounds. You have to be careful and use
goggles to protect your eyes if any part flies away. If you get a wound, the action depends on
the injury. If the wound is big you have to cover it and go to the hospital. If it's small you have
to clean it and put a bandaid on it. The fire from the bunsen burner is also a risk. You can burn
yourself if you are not careful and it can lead to permanent injuries. I accepted any
responsibility I was offered. The more you work, the more experience you will have. That will
benefit my future and will greatly help me. We all in the group were happy and helped each
other during the experiment. The only feedback I got is that we did a great job and were quick
to finish the experiment. Some of my partners did not read the temperature accurately. He just
took a quick look at the thermometer and recorded.
It’s better to prepare yourself 5 seconds before the recording time and then you can record.
Giving feedback to another person was quite hard for me. I was afraid that they would get a
bad idea about my personality and think that I am a bossy person. I will get used to it by the
time and it will be easier for me to give feedback in the future. I know that the way to record
the temperature that the boy did was wrong because the numbers on the liquid thermometer
are very small and easy to read them wrong. The digital thermometer is easier to see its
numbers, but the numbers are still small. The percentage to record a wrong temperature in this
way is quite high and to reduce it you have to look at the thermometer at least for 5 seconds.
After that you can record the temperature. The thing that we could improve is to record the
temperature every half minute instead of every minute. We could also record the temperature
more than 3 times, which will extend the time. More time will give us more results and we will
be more able to compare them with each other. We will in other words be able to see the most
reliable results and the ones that are less accurate.
Another thing is the ice melting temperature, which in literature is zero. The temperatures that
we recorded were more than zero, which means that the environment affected the ice
measurement. If we had a freezer we could put the thermometer in the beaker and then in the
freezer. It will give us a more accurate temperature for the iced water. Last but not least, one of
us could hold the thermometer all the time to have more accurate results. It’s a big mistake if
you let the thermometer touch the bottom of the beaker, especially in the boiling water. The
temperature will be higher in the middle of the bottom and lower on the sides. A thermometer
that touches the bottom will, in other words ,give us a different temperature than the actual

