100% satisfaction guarantee Immediately available after payment Both online and in PDF No strings attached
logo-home
Summary Comparing means Part 1 Notes £4.49
Add to cart

Summary

Summary Comparing means Part 1 Notes

 1 view  0 purchase

A summary of part 1 in a concise and easy to read manner

Preview 1 out of 2  pages

  • January 18, 2024
  • 2
  • 2021/2022
  • Summary
All documents for this subject (13)
avatar-seller
maryonanna
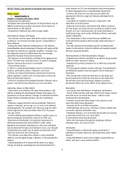
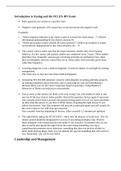
Comparing Means Part 1

Part One – significance testing and the independent samples t-test

Comparing means
 A step beyond comparing descriptives
 In experimental research, the interest is about manipulating an independent variable
in order to make a causal inference
 E.g. does listening to music improve exam performance – so we are comparing the
exam performance of music vs non music groups

Statistical significance
 The technical question asked: how likely is it that we should have obtained the
results that we did, assuming that the null hypothesis about the population is true?
 In other words – are differences between conditions so different we can truly say the
independent variable influences the dependent variable?
 This is why we conduct tests of significance

Significance testing
 Tests the probability of finding the differences in our results, assuming that the null
hyp. Of our population should be true
 In psych, we are looking for a probability value (/p value) of 5% or less (i.e. p_<.05)
 If significant results were “unlikely to occur by chance”
 If not say results are non-significant (NOT insignificant)
 ^^as other factors could have influenced results hence its appropriate to say its non
significant

The T-test
 Created by W.S Gosset under the pseudonym ‘Student’
o Testing whether yeast in beer batches affect quality
 As gusset went under the name ‘student’ the test statistic is called Student’s t
 When your performing statistical analyses and you get outputs you may find that
statistical tests have test statistic values such as students t e.g. pearson’s R or
spearman’s Rho
 t = observed difference between - expected difference between population
sample means means (assuming H0 is true)
estimate to the standard error of the difference between the
two sample means

 use this to create significant values but majority of time use SPSS to calculate t
values and p values also

The benefits of buying summaries with Stuvia:

Guaranteed quality through customer reviews

Guaranteed quality through customer reviews

Stuvia customers have reviewed more than 700,000 summaries. This how you know that you are buying the best documents.

Quick and easy check-out

Quick and easy check-out

You can quickly pay through credit card for the summaries. There is no membership needed.

Focus on what matters

Focus on what matters

Your fellow students write the study notes themselves, which is why the documents are always reliable and up-to-date. This ensures you quickly get to the core!

Frequently asked questions

What do I get when I buy this document?

You get a PDF, available immediately after your purchase. The purchased document is accessible anytime, anywhere and indefinitely through your profile.

Satisfaction guarantee: how does it work?

Our satisfaction guarantee ensures that you always find a study document that suits you well. You fill out a form, and our customer service team takes care of the rest.

Who am I buying these notes from?

Stuvia is a marketplace, so you are not buying this document from us, but from seller maryonanna. Stuvia facilitates payment to the seller.

Will I be stuck with a subscription?

No, you only buy these notes for £4.49. You're not tied to anything after your purchase.

Can Stuvia be trusted?

4.6 stars on Google & Trustpilot (+1000 reviews)

53022 documents were sold in the last 30 days

Founded in 2010, the go-to place to buy revision notes and other study material for 14 years now

Start selling
£4.49
  • (0)
Add to cart
Added