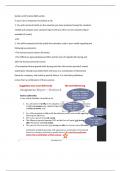
Section A (20 marks) (500 words)
In your role as Valuation Consultant at LA;
1. You will comment briefly on the valuation you have produced (using the valuation
model) and compare your valuation figure with any other current valuation figure
available (2 marks),
and;
2. You will be expected to fully justify the estimates used in your model regarding the
following key elements;
• The horizon period chosen (8 marks)
• The difference (spread) between ROIC and the Cost of Capital both during and
after the horizon period (5 marks)
• The expected future growth both during and after the horizon period (5 marks)
Justification should be provided with reference to a combination of theoretical
literature, company, and industry specific factors. It is vital that justification
comes from a combination of these sources.
, Section A
The report (Figure 1) valued Burberry at £5.117 billion(b) which, compared to Morningstar’s (2023)
5-year valuation of £7.63b, is over £2b lower than institutional valuation (Morningstar,2023).
However, Infront Analytics (2023) put the EV/EBITDA valuation at £5.22b for the UK which is more in
line with the report (InfrontAnylitics,2023).
Regarding the horizon period chosen in the report (figure 1), Mauboussin (1997) states that a 10-
year competitive advantage period (CAP) requires high return on capital, low rate of industry
change, and high barriers to entry (Mauboussin,1997). Burberry was identified to have high return
on invested capital compared to its cost of capital and the S&P500 returns(Marketwatch,2023),
which is a good indication of a healthy ROIC (Jiang & Koller,2007). A SWOT analysis identified
Burberry to have ‘extreme’ competition with an emphasis on fake products being a notable threat to
their advantage (IIDE,2021). MarketLine (2022) identifies that the industry has a low barrier to entry
force and interestingly, highlight the relatively high bargaining power of consumers due to low
switching costs. Concluding this information, the report justified a 7-year horizon period due to
these 3 factors balancing out the CAP between 5 and 10 years and Mauboussin (2006) warning
against choosing a horizon period that is too short (Mauboussin,2006).
Regarding the spread between ROIC and the cost of capital, Mauboussin (1997) highlights that
although a company can vary in performance over the CAP, the relationship between ROIC and cost
of capital held true. Knowing this, an average of the ROIC was chosen along with an average beta,
risk-free rate, and risk premium(Fernandez,2022; Table 4) which shows evidence of competitive
advantage. Using Yahoo finance(Yahoo,2023), a ROIC calculation(Yahoo,2017) was done to try and
get an understanding of how realistic the average was(Table1). It is worth mentioning however,
Burberry’s report changed how ROIC was calculated (Burberry,2022) so data was only taken up to
2020 as this would impact the results. After perpetuities Burberry will experience the ‘reversion-to-
the-mean phenomenon’ where the ROIC will eventually meet the cost of capital (Mauboussin,2006)
meaning that the spread will narrow due to decreasing ROIC and similar, but not rigid, cost of
capital.
Growth is forecasted by analysts and is found to be highly correlated across them and is more
accurate with large firms like Burberry however, accuracy tends to decrease with greater forecast
period (Damodaran,nd). The luxury clothing industry is nothing short of a mature industry and Jiang
and Koller (2007) state that it is impossible to avoid slow growth in such maturity which means the
growth figure used had to be relatively low compared to the ROIC. Using this information, a growth
figure was generated from an average of different analytical values including Burberry’s financial
report. Where possible, a 5-year forecast was used, while this reduces accuracy which can be
observed in the variable figures in table 2, it averaged to create an acceptable figure of 7.2%. After
the competitive advantage period, growth will drop off or stay the same since growth has no link to
value creation like ROIC does (Mauboussin,2006). Considering this, growth was chosen to take the
industry average since it is not in competitive advantage by its definition.