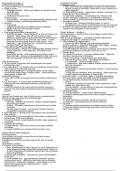
For the GCSE Pearson Edexcel B Geography the notes provided are a one page summary for the paper 2 which your GCSEs will be on (if you are sitting this specification)
These summaries are great as they not only cover all the content you need, but they also contain all the necessary case studies w...
Case studies for paper 2: Qualitative method:
Sheffield flooding (brief): Bipolar survey:
Summer 2007, River Don flooded o Desc: uses observer’s judgement to assess an environment
Natural causes: against a range of indicators. Often with a scale. Results on a
o Prolonged rainfall – 90mm and 100mm of rain fell on two spider diagram
separate days (+) Systematic sampling – reduces bias; random sampling; it’s a
o Soil saturation simple form of data collection
o Confluence of many rivers (-) systematic sampling – not all points have chance to be
Human causes: chosen; extremely subjective so is different to everyone;
o Urbanisation – inc amount of impermeable materials used random sampling can be inaccurate representation of area
o Climate change – enhanced greenhouse effect Secondary sources:
Impacts: o Geology map – Geology of Britain viewer- to view if
o 2 drowned management was correct in protecting area due to rock type
o 1200 homes flooded and 1000 businesses affected Shoreline management plan (from council) – to see how the
o Health risks from raw sewage in water coastline was managed at each location
o Millions in damage
Hard engineering flood management: Urban fieldwork – Stratford
o Build flood banks – raising banks of the river to increase its Aim/Hypothesis – Quality of life in east village is better than in
capacity – fairly cheap, one-off cost, however water carpenter’s estate
disperses quickly and increases the flood risk downstream Why did we go Stratford – accessible, recently regenerated,
o Divert river channel away from the city centre – creates compare East village & carpenter’s estate
diversion for excess away from the city centre – very Why Stratford for regeneration?
expensive – upto £14mil per km – protects city centre. o Chosen for 2012 Olympics so required regeneration
Increases flood risk elsewhere (+) New academy – educated 2000 pupils; East village – houses
Soft engineering flood management: 8000 people; Brownfield site – parkland
o Flood proofing – design new buildings/alter existing ones to (-) Unaffordable for Newham’s poorest; £8.77 bil cost; existing
reduce flood risk – very expensive, only affects new businesses displaced; produced 3.3mil tons of CO2.
buildings Primary data
o Flood plain zoning – refuse planning permission where (+) relevant to enquiry – accurate; updated data – collected
flood risk high – phases out development in high risk areas. real-time; simple, easy to interpret
Skls and hospitals will be built where flood risk lower (-) time-consuming → small sample size, expensive
o Index of decay/car survey – Quantitative/qualitative
Upland landscapes: (+) systematic – good coverage of area
In UK consists of igneous rock, metamorphic and some (-) subjective – own observations; biased; person may park
sedimentary rocks their car elsewhere
E.g. Lake district – its shape is due to its geology and processes o Questionnaires:
that acted on it in the past and now. (+) qualitative – opinions presented; random → equal chance
Other glacial landforms = U-shaped valleys, Corrie, Arête – of selection
narrow knife-edged ridge, Hanging valley – small valley that (-) data hard to condense; time consuming – able to get only
hangs above a larger one a small sample size; depends on time of day
Lowland landscapes: Secondary data – e.g Census, Index of multiple deprivation
In the UK, consists of younger and less resistant sedimentary (+) cheap, time saving, accessible, provide background info
rock. (-) out dated, biased, irrelevant to enquiry question
E.g. the weald – as erosion and weathering happened, it o Census
exposed the rock underneath leaving a scarp and vale (+) provides overview of social life, easy comparisons, large
landscape sample size, high return rate
Landforms found in the south were formed by moraines – (-) lacks validity – serves interest of elite and manipulated by
mass of rock and sediment which has been transported by state; changes over time; out dated
glacier) Chloropleth map:
(+) visually effective – colour=value; flexible layout
Cornwall: (-) assumes whole region has same value; abrupt changes in
Lack of rural investment, lack of high income, unemployment boundaries
20% of working age earns less than living age Line graph
Reasons for decline: (+) visual impression of trends; simple to construct
o Farming – falling farm revenues, cheaper imported goods, (-) cluttered – complicated due to uneven intervals
decreased gov grants Pie chart
o Fishing – EU quotas caused some fish stock to go to other (+) displays relative proportions of multiple classes of data
countries (-) does not easily show changes over time; does not reveal
o Tin and copper mining – overmining, cheaper overseas exact value of data
competition, expensive exports
Diversification = varying service provided in the countryside
Eden project:
(+) generates £1.1 bil and attracts 13mil visitors; employs 650
ppl and uses 2700 local suppliers
(-) costed £140mil; creates pollution+traffic; older people not
employed
Superfast broadband:
(+) High take up - 96% have access; encourages industry
relocation
(-) costed £182bil; poor transport links to urban core
Walton-On-The-Naze Fieldwork:
Aim/Hypothesis:
Local people and tourists benefit from the WoN coastal
management methods
Managements methods aw WoN reduce the rate of coastal
erosion.
Quantitative method:
Groyne measurement:
o Desc: measured each side of groyne to see if sediment was
being trapped through systematic measurement. Allows us
to see if management methods reduced the rate of erosion
(link to hypothesis)
(+) Systematic sampling – reduced bias, good representation
of the area
(-) Small sample size – only had time to measure 1 groyne ;
measurement error – difficult to hold ruler and to measure
form the top ; Systematic sampling – more biased as not all
points have equal chance of being chosen – under
representation of area
The benefits of buying summaries with Stuvia:
Guaranteed quality through customer reviews
Stuvia customers have reviewed more than 700,000 summaries. This how you know that you are buying the best documents.
Quick and easy check-out
You can quickly pay through credit card for the summaries. There is no membership needed.
Focus on what matters
Your fellow students write the study notes themselves, which is why the documents are always reliable and up-to-date. This ensures you quickly get to the core!
Frequently asked questions
What do I get when I buy this document?
You get a PDF, available immediately after your purchase. The purchased document is accessible anytime, anywhere and indefinitely through your profile.
Satisfaction guarantee: how does it work?
Our satisfaction guarantee ensures that you always find a study document that suits you well. You fill out a form, and our customer service team takes care of the rest.
Who am I buying these notes from?
Stuvia is a marketplace, so you are not buying this document from us, but from seller arshadahsan2007. Stuvia facilitates payment to the seller.
Will I be stuck with a subscription?
No, you only buy these notes for £7.48. You're not tied to anything after your purchase.