100% satisfaction guarantee Immediately available after payment Both online and in PDF No strings attached
logo-home
Summary IB ECONOMICS HL, DETAILED NOTES, UNIT 3 MACROECONOMICS (w real world examples) £15.86   Add to cart

Summary

Summary IB ECONOMICS HL, DETAILED NOTES, UNIT 3 MACROECONOMICS (w real world examples)

 12 views  0 purchase

Written by someone who achieved a 7 in HL Economics, this document provides an in-depth guide to unit 3 of HL Economics (macroeconomics). This guide includes detailed real world examples (of monetary policy, for example) which are vital in securing a level 7 in HL Economics :)

Preview 4 out of 37  pages

  • September 10, 2024
  • 37
  • 2024/2025
  • Summary
All documents for this subject (3)
avatar-seller
ishana84
The level of overall economic activity


The circular flow of income shows that in any given time period, the value of output produced in an
economy is equal to the total income generated in producing that output, which is equal to the
expenditures made to purchase that output.

Leakages Injections
Savings Investment
Taxes Government spending
Import spending Export spending

If leakages>injections, then the size of circular flow becomes smaller


Ways to measure aggregate output (national output)

1. Expenditure approach
- Total amount of spending to buy FINAL goods and services in a country, within a year.
The term final means that the goods and services are ready for final use.
- Total spending is broken down into 4 components (Consumption, investment *on capital
goods and construction*, government spending, net exports)

2. Income approach
- Adds up all income earned by the factors of production
- Wages earnt by labour, rent earned by land, interest earned by capital and profit earned
by entrepreneurship= national income
- This approach allows economists to see the relative income shares of the different
factors of production

3. Output approach
- Measures the value of each good and service produced in the economy over a particular
time period, and then sums them up to obtain the total value of output produced.
- Provides economists with the opportunity to study the performance of each individual
sector by looking at relative share in total output.

,GDP: total value of all final goods and services produced within a country over a time period
(regardless of who owns the factors of production)

GNI: total income received by the residents of a country, equal to the value of all final goods and
services produced by the factors of production supplied by the country’s residents regardless where
the factors are located.


Nominal: in terms of current prices

Real: eliminated the influence of changes in price (adjusted for inflation)

Purchasing power parity: involves looking at a basket of goods to determine effective living costs
(buying power equivalence)


CALCULATIONS:

1. GNI= GDP + net income from abroad
2. To find real GDP multiply quantities of output by base year prices

A price index is a measure of average prices one period relative to average prices in a base
year, and a price index which is commonly used to convert nominal GDP to real GDP is a
price deflator aka: GDP deflator

𝑛𝑜𝑚𝑖𝑛𝑎𝑙 𝐺𝐷𝑃
3. GDP deflator= x100
𝑟𝑒𝑎𝑙 𝐺𝐷𝑃
4. Per capita values: divide by population


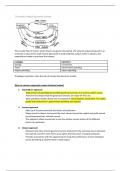
The business cycle

, o Expansion/Recovery: positive growth in real GDP, employment of resources increases,
general price level tends to rise, rising investment, rising confidence and loose policy is
pursued to prevent recession
o Boom/Peak: unemployment of resources falls substantially, high consumer/business
confidence, sucking in of imports and likely demand-pull inflation
o Recession/trough: declining AD, poor confidence, increasing unemployment.

- GDP fluctuate with other macroeconomic variables, mainly the unemployment of
labour (consider the level of full employment) SO: when actual GDP<potential GDP,
there is an –ve output gap so unemployment> natural rate of unemployment

Using business cycle we can understand the macroeconomic objective to include:

1. Reducing intensity of expansion and contraction to make output gaps as small as possible, to
lessen to problems of rising price levels or inflation
2. Increasing steepness of trend growth would help achieve more rapid economic goth over
long periods of time.


Why are national income statistics important?
• They allow governments to see if they are meeting economic goals
• Allows them to forecast (expected growth)
• They allow governments to evaluate policies, to evaluate standard of living
• Allows for comparison between economies
Pros Cons

National statistics can help with policy development Not entirely accurate e.g.: fails to include
black economy

Economic planning, statistics can be used to predict Rise in national income does not
future trends so we can therefore plan for them necessarily mean a rise in standards of
(long/short-term planning) living

Stats are standardised hence we can easily compare Unpaid activities are unaccounted for
differences between countries, and within a country yet, they are still services/activity
(which can help expose inequalities)

Can you quantify such complex matters
such as quality of life?

, CONS:
• Risk of double counting (including value of primary sector, and then include that value again
when primary good has been transformed into secondary sector product)- thus this risks
inflation of final figure of GDP
• Informal activity (some activities with market value will not be included in GDP, and
therefore GDP will be undervalued)
• Data collection: there is a lot of data to be collected, and needs to be collected in short time
period, therefore the chance for error is very large.
• GDP as representative of standard of living: it simply looks at quantity of output, not the
quality of the output. Hence, negative externalities will not be included in the GDP. It may be
argued that if negative externalities (e.g. Air pollution) were accounted for, that standard of
living would be lower.
• Ignores income inequality
• The type of good being produced needs to be considered. E.g. If only capital goods are being
produced, that does not benefit the individual, it benefits firms/businesses and this benefit
takes a long time to reach households/consumers, thus if only capital is being produced this
may not correlate to increased standards of living
• Many other quality of life aspects are ignored by GDP (healthcare outcomes, education
access..)

Definitions Advantage Disadvantage Other Notes
GDP The total value of all goods and services - Double counting (counting value when sold in primary sector
produced and also counting value when good is manufactured in the
secondary sector
- Informal activity e.g.: car washing, gardening... is not included
hence GDP is lower than expected
- Negative externalities of production are not included in figure
(e.g.: loss of biodiversity), so living standards are not
accurately represented- alternative = Green GDP
- Nothing mentioned of distribution of GDP/wealth inequality
- Average level of income is ignored: it is relative to population
growth (but alternative= GDP per capita)
GDP per capita The total value of goods and services
produced divided by population - For example, in tax haven countries such as Bermuda- the
GDP per capital is extremely high, while in reality most
individuals of the population work in small fishing industries
- If we create the false impression that standard of living of all
individuals is good then we are hindering progressive policy
making
- GDP does not take into account remittances/income earnt
abroad, even though this income contributed to improved
standards of living (think domestic workers/helpers)
- Influence of FDI/foreign businesses- the goods produced in
the country will be accounted for however, the
money/profit from goods are not necessarily kept in the
country and are often sent back to original country hence
GDP value could be inflated/DISTORTED- solution= GNI
GNI= The total income generated by a countries - Income from abroad by locals will be
factors of production (e.g.: labour), accounted for e.g. Bangladesh - No account of environmental costs
regardless of where factor of production - Better measure of standard of - Income inequality is ignored so it is not an accurate reflection
is located. living/economic stimulation- especially for of standard of living. Instead, with inequality, the standard of
developing countries where remittances are living- as reflected by GDP would be inflated.
GNI= GDP + net factor income very significant

(net factor income= income earned by
domestic firms/workers subtract income
earned by foreign workers/firms)
PPP Purchasing Power Parity- - Comparison of living costs between Big mac index: a way to measure the purchasing power of
countries - big mac index, for example, fails to consider that in different currencies
looking at a basket of goods and services - It gives an indication of the value of a different countries there are different consumers, with
to determine effective living costs. It is currency/what money can be in different different tastes, hence there is varying "willingness" to - Big mac because it is universally available
determined by dividing the prices of a countries pay certain prices for a burger/ "big-mac" - It is a standardised product (same ingredients etc..)
basket of products in one country but the - High cost of living vs low cost of living will - Therefore in theory, big mac across countries should be
cost of basket of products in another. give you different purchasing power - Big mac is not the same in all countries the same price.

Why the price difference?
- Differences in incomes per capita/high vs low income, if
population is high income then retailers can sell the big
mac at a greater price and guarantee demand

- Variations in marginal costs of supply due to cost of
factors of production: commercial rents and minimum
wage, for example.

- Exchange rates: a dollar can there buy a lot of land etc...

- Differences in taxation, some big macs may be taxed in
some countries while in others, not.
- Tariffs will also have an impact: cost of importing
ingredients etc..

Happiness Index A survey which assesses happiness in 10 -in poorer countries the correlation between
different areas of life (wellbeing, health,GDP and wellbeing is stronger however as a - Survey is subjective
social support, education, environment...) country gets more developed, the correlation - Who is answering survey?- is it really representative
becomes less strong. THIS MAY BE - Can you reduce complex matters e.g. Psychological wellbeing
The data collected from the survey is used EXPLAINED DUE TO DIMINISHING MARGINAL to a quantitative scale of 1-10?
to evaluate the happiness of people UTILITY OF WEALTH AND INCOME E.g:
despite strong economic growth, in the USA
IN 2021 FINLAND RANKES AS HAPPIEST life expectancy has decreased and inequality
COUNTRY WITH SCORE OF 7.8/10 has grown

The benefits of buying summaries with Stuvia:

Guaranteed quality through customer reviews

Guaranteed quality through customer reviews

Stuvia customers have reviewed more than 700,000 summaries. This how you know that you are buying the best documents.

Quick and easy check-out

Quick and easy check-out

You can quickly pay through credit card for the summaries. There is no membership needed.

Focus on what matters

Focus on what matters

Your fellow students write the study notes themselves, which is why the documents are always reliable and up-to-date. This ensures you quickly get to the core!

Frequently asked questions

What do I get when I buy this document?

You get a PDF, available immediately after your purchase. The purchased document is accessible anytime, anywhere and indefinitely through your profile.

Satisfaction guarantee: how does it work?

Our satisfaction guarantee ensures that you always find a study document that suits you well. You fill out a form, and our customer service team takes care of the rest.

Who am I buying these notes from?

Stuvia is a marketplace, so you are not buying this document from us, but from seller ishana84. Stuvia facilitates payment to the seller.

Will I be stuck with a subscription?

No, you only buy these notes for £15.86. You're not tied to anything after your purchase.

Can Stuvia be trusted?

4.6 stars on Google & Trustpilot (+1000 reviews)

85443 documents were sold in the last 30 days

Founded in 2010, the go-to place to buy revision notes and other study material for 14 years now

Start selling
£15.86
  • (0)
  Add to cart