100% satisfaction guarantee Immediately available after payment Both online and in PDF No strings attached
logo-home
Summary Matplotlib Comprehensive Notes, Cheat Sheets, and Study Guide £3.24   Add to cart

Summary

Summary Matplotlib Comprehensive Notes, Cheat Sheets, and Study Guide

 5 views  0 purchase
  • Module
  • Institution

Master data visualization in Python with this comprehensive set of Matplotlib notes. Covering key topics such as plotting line charts, bar graphs, histograms, and scatter plots, these notes are designed for both beginners and advanced users. With cheat sheets, quick references, and code examples, t...

[Show more]
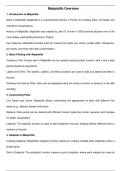
Preview 1 out of 3  pages

  • September 30, 2024
  • 3
  • 2024/2025
  • Summary
avatar-seller
Matplotlib Overview
1. Introduction to Matplotlib

What is Matplotlib: Matplotlib is a comprehensive library in Python for creating static, animated, and

interactive visualizations.

History of Matplotlib: Matplotlib was created by John D. Hunter in 2003 and has become one of the

most widely used plotting libraries in Python.

Key Features: Matplotlib provides tools for creating line plots, bar charts, scatter plots, histograms,

pie charts, and more with high customization.

2. Basic Plotting with Matplotlib

Creating a Plot: A basic plot in Matplotlib can be created using the plot() function, with x and y data

points passed as arguments.

Labels and Titles: The xlabel(), ylabel(), and title() functions are used to add axis labels and titles to

the plot.

Showing and Saving Plots: Plots can be displayed using the show() function or saved to a file with

savefig().

3. Customizing Plots

Line Styles and Colors: Matplotlib allows customizing the appearance of plots with different line

styles (e.g., dashed, dotted) and colors.

Markers: Data points can be marked with different marker styles like circles, squares, and triangles

for better visualization.

Legends: The legend() function is used to add a legend to the plot, helping identify different lines or

markers in the plot.

4. Subplots in Matplotlib

Creating Subplots: Matplotlib's subplot() function allows for creating multiple plots (subplots) within a

single figure.

Grid of Subplots: The subplots() function creates a grid of subplots, where each subplot can have its

The benefits of buying summaries with Stuvia:

Guaranteed quality through customer reviews

Guaranteed quality through customer reviews

Stuvia customers have reviewed more than 700,000 summaries. This how you know that you are buying the best documents.

Quick and easy check-out

Quick and easy check-out

You can quickly pay through credit card for the summaries. There is no membership needed.

Focus on what matters

Focus on what matters

Your fellow students write the study notes themselves, which is why the documents are always reliable and up-to-date. This ensures you quickly get to the core!

Frequently asked questions

What do I get when I buy this document?

You get a PDF, available immediately after your purchase. The purchased document is accessible anytime, anywhere and indefinitely through your profile.

Satisfaction guarantee: how does it work?

Our satisfaction guarantee ensures that you always find a study document that suits you well. You fill out a form, and our customer service team takes care of the rest.

Who am I buying these notes from?

Stuvia is a marketplace, so you are not buying this document from us, but from seller 014csearunnachalamrs. Stuvia facilitates payment to the seller.

Will I be stuck with a subscription?

No, you only buy these notes for £3.24. You're not tied to anything after your purchase.

Can Stuvia be trusted?

4.6 stars on Google & Trustpilot (+1000 reviews)

75323 documents were sold in the last 30 days

Founded in 2010, the go-to place to buy revision notes and other study material for 14 years now

Start selling
£3.24
  • (0)
  Add to cart