Arithmetic mean - Study guides, Revision notes & Summaries
Looking for the best study guides, study notes and summaries about Arithmetic mean? On this page you'll find 1120 study documents about Arithmetic mean.
Page 3 out of 1.120 results
Sort by
-
CFA LEVEL 1 QUESTIONS AND ANSWERS
- Exam (elaborations) • 9 pages • 2024
- £9.92
- + learn more
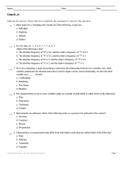
What are the 4 types of measurement scales? - Answer-1. Nominal Scales 2. Ordinal Scales (Assigned to a category) 3. Interval Scales (Relative ranking) 4. Ratio Scales (Equal differences between scale values) NOIR When do we use geometric and arithmetic means to analyze investment returns? - Answer-Arithmetic Mean: To estimate next year's return Geometric Mean: Measure of past performance What are the 3 different types of probabilities? - Answer-1. Empirical Probability (Past data) ...
-
Test Bank for The Analysis of Biological Data, 3rd Edition by Michael C. Whitlock
- Exam (elaborations) • 361 pages • 2022
- £31.77
- 13x sold
- + learn more
Test Bank for The Analysis of Biological Data 3e 3rd Edition by Michael C. Whitlock, Dolph Schluter ISBN-13: 4433 PART 1 INTRODUCTION TO STATISTICS 1.0 Statistics and samples 1.1 What is statistics? 1.2 Sampling populations 1.3 Types of data and variables 1.4 Frequency distributions and probability distributions 1.5 Types of studies 1.6 Summary Interleaf 1 Correlation does not require causation 2.0 Displaying data 2.1 Guidelines for effective graphs 2.2 Showing data for one va...
-
Biostatistics BCPS questions and answers 2023
- Exam (elaborations) • 5 pages • 2023
- £7.94
- 1x sold
- + learn more
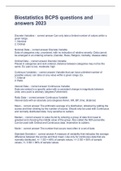
Biostatistics BCPS questions and answers 2023Discrete Variables Can only take a limited number of values within a given range. 1. Nominal 2. Ordinal Nominal Data Discrete Variable Data of categories only, unordered, with no indication of relative severity. Data cannot be arranged in an ordering scheme. (Gender, Race, Religion, mortality, disease state) 00:56 01:13 Ordinal Data Discrete Variable Placed in categories and rank ordered, distance between categories may ...
-
RHIA Domain 5 Test Questions and Correct Answers
- Exam (elaborations) • 15 pages • 2024
- £10.32
- + learn more
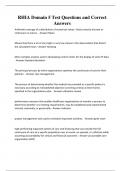
Arithmetic average of a distribution of numerical values. Values may be discrete or continuous in nature. - Answer Mean Means that there a lot of very high or very low values in the observations that distort the calculated mean - Answer Skewing More complex analysis used in developing control charts for the display of some PI data. - Answer Standard deviation
-
CFA Level 1 - 101 Must Knows 368 Questions with Verified Answers,100% CORRECT
- Exam (elaborations) • 54 pages • 2023
- £8.73
- 1x sold
- + learn more
CFA Level 1 - 101 Must Knows 368 Questions with Verified Answers Addition Rule of Probability - CORRECT ANSWER ADDITION: P(A or B) = P(A) + P(B) - P(AB) Roy's Safety First Criterion - CORRECT ANSWER Safety First Ratio = (E(R) - Rₜ) / σ Larger ratio is better If (Rₜ) is risk free rate, then it becomes Sharpe Ratio Sharpe Ratio - CORRECT ANSWER Sharpe Ratio = (E(R) - RFR) / σ Larger ratio is better If (Rt) is higher than RFR, then it becomes Safety First Ratio Centra...

And that's how you make extra money

-
AHIMA CCA: Reimbursement Methodologies Questions & Answers 2024.
- Exam (elaborations) • 14 pages • 2024
- £8.73
- + learn more
AHIMA CCA: Reimbursement Methodologies Questions & Answers 2024. 1. Given the following information, which of the following statements is correct? 191, MCD: 04, Type: MED MS-DRG, Title: Chronic obstructive pulmonary disease w/ CC, Weight: 0.9757, Discharges: 10, Geometric Mean: 4.1, Arithmetic Mean: 5.0, 192, MCD: 04, Type: COPD w/o CC/MCC, Weight: 0.7254, Discharges: 20, Geometric Mean: 3.3, Arithmetic Mean: 4.0 193, MCD: 04, Type: MED, Weight: Simple pneumonia & pleurisy w/ MCC, Weig...

-
NSG 522 Pre Midterm Questions and Correct Answers | Latest Update
- Exam (elaborations) • 40 pages • 2024
- £11.19
- + learn more
Frequencies Just the count or number of observations in each category. Abbreviated as 'n' or 'f' Relative Frequency The number of times a particular observation occurs divided by the total number of observations. Frequency Distribution A summary of the numerical counts of the values or categories of a measurement. Cumulative Frequency The number of observations with a value less than the maximum value of the variable interval. Cumulative Relative Frequency Master...

-
Life-Span Development Final (Straighterline) test questions and answers.
- Exam (elaborations) • 18 pages • 2024
- £11.91
- + learn more
The main purpose of descriptive statistics is to Summarize data in a useful and informative manner Which word is NOT part of the definition of descriptive statistics? Predicting A marketing class of 50 students evaluated the instructor using the following scale: superior, good, average, poor, and inferior. The descriptive summary showed the following survey results: 2% superior, 8% good, 45% average, 45% poor, and 0% inferior. c. Most students rated the instructor as poor or ave...
-
NURS 5366 week 5 Nursing Research Statistics Questions and Answers (100% Pass)
- Exam (elaborations) • 34 pages • 2024
- £10.72
- + learn more
descriptive Statistics computed to reveal characteristics of the sample and to describe study variable How to describe a sample create a frequency distribution of the variable or variable being studied - is a plot of one variable, whereby the x-axis consists of possible values of that variable , and the y - axis is tally of each value Inferential Statistics computed to draw conclusions and make inferences about the greater population, based on the sample data set. Master01 | S...
-
NSG 522 Midterm Exam Questions And All Correct Answers.
- Exam (elaborations) • 21 pages • 2024
- £7.94
- + learn more
Frequencies - Answer Just the count or number of observations in each category. Abbreviated as 'n' or 'f' Relative Frequency - Answer The number of times a particular observation occurs divided by the total number of observations. Frequency Distribution - Answer A summary of the numerical counts of the values or categories of a measurement. Cumulative Frequency - Answer The number of observations with a value less than the maximum value of the variable interval. Cumul...
