Alexperez
On this page, you find all documents, package deals, and flashcards offered by seller alexperez.
- 46
- 3
- 3
Community
- Followers
- Following
52 items
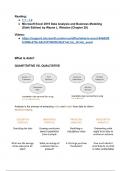
Analytics I: Data Management and Analysis
Amount of data businesses are able to maintain & process is growing exponentially,& the ability to manage that data successfully can give a business a tremendous competitive advantage; business data landscape, basic data management and analysis skills; data collection, data cleansing and mining, statistical and graphical analysis, basic modeling
- Package deal
- • 8 items •
- Lecture #1 - Introduction to Data Analysis • Class notes
- Lecture #2 - Data Strategy • Class notes
- Lecture #3 - Data Analysis • Class notes
- Lecture #4 - Descriptive Statistics Part #1 • Class notes
- Lecture #5 - Descriptive Statistics Part #2 • Class notes
- And more ….
Amount of data businesses are able to maintain & process is growing exponentially,& the ability to manage that data successfully can give a business a tremendous competitive advantage; business data landscape, basic data management and analysis skills; data collection, data cleansing and mining, statistical and graphical analysis, basic modeling
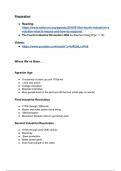
The Fourth Industrial Revolution & Starting a Business
Business's role to customers & stakeholders; marketing, finance & accounting, & product/service innovation & creativity are introduced. Key 4th industrial revolution technologies such as AI, Internet of Things (IoT), distributed ledger technology & cryptocurrency,augmented/mixed/virtual reality,additive manufacturing,& autonomous,robotics,& drones
- Package deal
- • 23 items •
- Lecture #1 - The Fourth Industrial Revolution • Class notes
- Lecture #2 - The Internet of All Things • Class notes
- Lecture #3a - Artificial Intelligence • Class notes
- Lecture #3b - Drones • Class notes
- Lecture #4a - Extended Reality & Autonomous Vehicles • Class notes
- And more ….
Business's role to customers & stakeholders; marketing, finance & accounting, & product/service innovation & creativity are introduced. Key 4th industrial revolution technologies such as AI, Internet of Things (IoT), distributed ledger technology & cryptocurrency,augmented/mixed/virtual reality,additive manufacturing,& autonomous,robotics,& drones
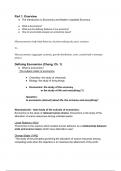
Economics: A Critical Introduction
Basic economic concepts; theories; potential impact of policy recommendations on different individuals & social groups; relation of the economy to public and private life; inequality and discrimination; globalization; capitalism generates generates crises of inequality & discrimination, & environmental sustainability; agents and institutions
- Package deal
- • 15 items •
- Lecture #1 - Introduction to Economics • Class notes
- Lecture #2 - Defining Economics • Class notes
- Lecture #3 - Introduction to Capitalism • Class notes
- Lecture #4 - Classical & Managerial Capitalism • Class notes
- Lecture #5 - Toward Financial Capitalism • Class notes
- And more ….
Basic economic concepts; theories; potential impact of policy recommendations on different individuals & social groups; relation of the economy to public and private life; inequality and discrimination; globalization; capitalism generates generates crises of inequality & discrimination, & environmental sustainability; agents and institutions
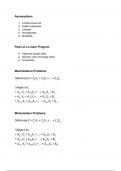
Lecture #8 - Linear Programming
Identify the objective, decision cells, and constraints in an optimization problem. Set up an optimization problem in Excel. Set up Solver to solve an optimization problem in Excel.
- Book & Paket-Deal
- Class notes
- • 4 pages •
Identify the objective, decision cells, and constraints in an optimization problem. Set up an optimization problem in Excel. Set up Solver to solve an optimization problem in Excel.
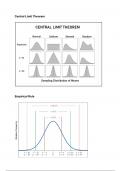

Lecture #7 - The Normal Distribution
Explain the central limit theorem. Apply the empirical rule to a normal data set. Apply Chebychev's theorem to a non-normal data set. Calculate z-scores for values in a data set. Identify outliers in a data set using z-scores.
- Book & Paket-Deal
- Class notes
- • 3 pages •
Explain the central limit theorem. Apply the empirical rule to a normal data set. Apply Chebychev's theorem to a non-normal data set. Calculate z-scores for values in a data set. Identify outliers in a data set using z-scores.
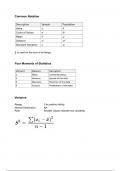
Lecture #6 - Measures of Dispersion
Explain how measures of dispersion describe variability in a data set. Identify skewness and kurtosis in a data set. Calculate the variance and standard deviation of a data set.
- Package deal
- Class notes
- • 3 pages •
Explain how measures of dispersion describe variability in a data set. Identify skewness and kurtosis in a data set. Calculate the variance and standard deviation of a data set.
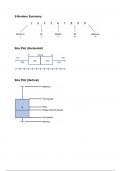

Lecture #5 - Descriptive Statistics Part #2
Construct a box plot to visualize the 5-number of summary of a data set. Match a frequency distribution to a corresponding box plot. Calculate the upper and lower fences for outliers using the interquartile range. Identify outliers using the interquartile range method.
- Book & Paket-Deal
- Class notes
- • 5 pages •
Construct a box plot to visualize the 5-number of summary of a data set. Match a frequency distribution to a corresponding box plot. Calculate the upper and lower fences for outliers using the interquartile range. Identify outliers using the interquartile range method.
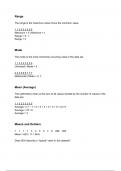

Lecture #4 - Descriptive Statistics Part #1
Explain the measures of central tendency. Calculate the mean, median, and mode of a data set. Calculate the range, quartiles, and interquartile range of a data set. Construct a 5-number summary of a data set.
- Book & Paket-Deal
- Class notes
- • 5 pages •
Explain the measures of central tendency. Calculate the mean, median, and mode of a data set. Calculate the range, quartiles, and interquartile range of a data set. Construct a 5-number summary of a data set.
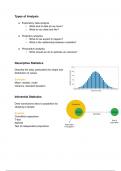

Lecture #3 - Data Analysis
Explain the difference between descriptive and inferential statistics. Identify the types of data and levels of measurement. Calculate relative and cumulative frequencies frequencies. Use pivot tables to explore a new data set.
- Book & Paket-Deal
- Class notes
- • 3 pages •
Explain the difference between descriptive and inferential statistics. Identify the types of data and levels of measurement. Calculate relative and cumulative frequencies frequencies. Use pivot tables to explore a new data set.
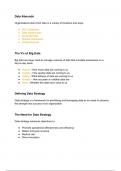
Lecture #2 - Data Strategy
Explain the "V's" of big data. Discuss the role of data strategy in an organization. Describe the principle components of effective data strategy. Identify common gaps in data strategy.
- Package deal
- Class notes
- • 7 pages •
Explain the "V's" of big data. Discuss the role of data strategy in an organization. Describe the principle components of effective data strategy. Identify common gaps in data strategy.
