Boxplot - Samenvattingen, Notities en Examens
Op zoek naar een samenvatting over Boxplot? Op deze pagina vind je 303 samenvattingen over Boxplot.
Alle 303 resultaten
Sorteer op
-
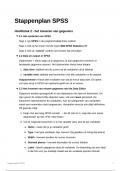
Duidelijk STAPPENPLAN voor Cursus SPSS!
- Samenvatting • 18 pagina's • 2023
-
- €3,99
- 30x verkocht
- + meer info
In dit stappenplan vind je per onderwerp beschreven welke stappen je moet uitvoeren in SPSS om een bepaalde opdracht uit te voeren. De stappen zijn helder en gedetailleerd omschreven. Met dit stappenplan kan je makkelijk een hoog cijfer halen!
-
WGU Intro to Probability and Statistics | 107 Questions and Answers(A+ Solution guide)
- Tentamen (uitwerkingen) • 15 pagina's • 2023
-
Ook in voordeelbundel
-
- €6,38
- 1x verkocht
- + meer info
Population - The entire group that is the target of interest, not just people. Eg, "the population of 1 bedroom apartments" Sample - A subgroup of the population. Eg, "the 1 bedroom apartments with dishwashers." Steps in the statistics process - 1. PRODUCE DATA (by studying a sample of the population) 2. EXPLORATORY DATA ANALYSIS (Summarize data.) 3. PROBABILITY ANALYSIS (Determine how the sample may differ from the population.) 4. INFERENCE (draw conclusions) Data - pieces of info ab...
BOXPLOT AND OUTLIER QUESTIONS & ANSWERS 2024 LATEST UPDATE
-
Hoorcolleges Statistiek 1 Pedagogische wetenschappen+
- College aantekeningen • 90 pagina's • 2023
-
- €4,99
- 2x verkocht
- + meer info
Hier staan de hoorcolleges 1.1 tm 6.2 van het vak statistiek 1 heel uitgebreid beschreven. Dit vak is van de opleiding Vrije Universiteit en werd bij mij gegeven tijdens de Premaster (PMC). Er staan veel voorbeelden in waarin uitgelegd wordt hoe je iets berekend. Het heeft mij ontzettend geholpen.
-
Notities dataverwerking (OWA00R)
- Samenvatting • 45 pagina's • 2023
-
- €5,99
- 1x verkocht
- + meer info
Dit document bevat de uitgebreide notities van het vak 'dataverwerking' gegeven in het derde jaar, door H. Arnouts (OWA00R). Alle notities van alle lessen en enkele voorbeeldoefeningen zijn terug te vinden in dit document.
BOXPLOT AND OUTLIER QUESTIONS & ANSWERS 2024 LATEST UPDATE

-
Overzicht EXCEL - holy grail bij het maken van de exceltest - statistiek - 1VAS - HOGENT
- Samenvatting • 6 pagina's • 2023
-
- €6,49
- 14x verkocht
- + meer info
Ik had een score van 87% op de test van excel mede door dit overzicht. Onder andere staat er hoe je een bosplot moet opbouwen, stap voor stap, bepaalde formules voor het berekenen van gemiddelde, modus etc. (inclusief screenshots van instellingen)
-
BOXPLOT AND OUTLIER QUESTIONS & ANSWERS 2024 LATEST UPDATE|GUARANTEED SUCCESS
- Tentamen (uitwerkingen) • 4 pagina's • 2023
-
- €12,77
- + meer info
It is necessary to mark the extreme outliers on a box plot. True False True Given the data set 42, 52, 79, 112, 48, 28, 43, 44, 44, 10, 44, what are the mild outlier(s)? 28, 79 79, 112 79 44, 52 79 Brainpower 0:04 / 0:15 What is the Q1, median, and Q3 of a data set with the following values: 42, 52, 79, 112, 48, 28, 43, 44, 44, 10, 44? Q1=42, Median=44, Q3=52 Q1=43, Median=44, Q3=52 Q1=42, Median=44, Q3=48 Q1=43, Median=48, Q3=52 Q1=42, Median=4...
-
WGU C955 Probability and Statistics (2022/2023) Already Passed
- Tentamen (uitwerkingen) • 8 pagina's • 2023
-
Ook in voordeelbundel
-
- €9,82
- 1x verkocht
- + meer info
WGU C955 Probability and Statistics (2022/2023) Already Passed Boxplot an image that has min, Q1, median, Q3, max Histogram A graphical representation -- bars, measuring the frequency within each interval Skewed right Not a symmetric distribution, the tail is on the right, i.e. extra stuff on the right Measures of center Median, the mean (and mode) Measures of spread Range, IQR & standard deviation Standard Deviation Rule 68% of the data are within 1 standard deviation, 95% are within 2, 99...

-
Tornado Project - College of Healthcare Administration, Baker College MTH2750-A4, STATISTICAL METHODS Feb 2022
- Tentamen (uitwerkingen) • 14 pagina's • 2023
-
- €9,82
- 1x verkocht
- + meer info
Tornado Project - College of Healthcare Administration, Baker College MTH2750-A4, STATISTICAL METHODS Feb 2022 1. Tornadoes are the topic of this project. What do you know about tornadoes? What resea rch has already been done on tornadoes? Find and cite at least two scholarly sources/references. Summarize the research you uncovered in 3-5 paragraphs. The F Scale is a qualitative variable that categorizes tornadoes by their wind speed. Part of your research should include a discussion of the F Sc...

Studiestress? Voor verkopers op Stuvia zijn dit juist gouden tijden. KA-CHING! Verdien ook aan je samenvattingen en begin nu met uploaden. Ontdek alles over verdienen op Stuvia

