MATH 225N Week 7 Assignment
Hypothesis Test for the Mean
Week 7 Assignment Hypothesis Test for the mean-Polution Standard Deviation known
Compute the value of the test statistic (z-value) for a hypothesis test for one population mean with a
known standard deviation
Question
Jamie, a bowler, claims that her bowling score is less than 168 points, on average.
Several of her teammates do not believe her, so she decides to do a hypothesis
test, at a 1% significance level, to persuade them. She bowls 17 games. The mean
score of the sample games is 155 points. Jamie knows from experience that the
standard deviation for her bowling score is 19 points.
H 0:
μ≥168; Ha: μ<168
α=0.01 (significance level)
What is the test statistic (z-score) of this one-mean hypothesis test, rounded to two
decimal places?
Provide your answer: Test statistic = -2.82
Correct answers:
Test statistic = −2.82
The hypotheses were chosen, and the significance level was decided on, so the next
step in hypothesis testing is to compute the test statistic. In this scenario, the
sample mean score, x¯=155. The sample the bowler uses is 17 games,
so n=17. She knows the standard deviation of the games, σ=19. Lastly, the
bowler is comparing the population mean score to 168points. So, this value
(found in the null and alternative hypotheses) is μ0. Now we will substitute the
values into the formula to compute the test statistic:
z0=x¯−μ0σn√=155−1681917√≈−134.608≈−2.82
So, the test statistic for this hypothesis test is z0=−2.82.
Distinguish between one- and two-tailed hypotheses tests and understand possible conclusions
Question
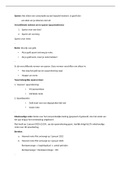
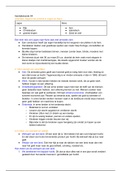
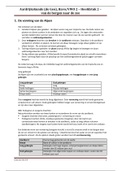
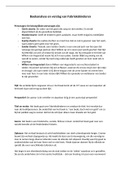
Which graph below corresponds to the following hypothesis test?
H0:μ≥5.9, Ha:μ<5.9
Answer Explanation
,Correct answer:
A normal curve is over a horizontal axis and is centered on 5.9. A vertical line
segment extends from the horizontal axis to the curve at a point to the left of 5.9.
The area under the curve to the left of the point is shaded.
The alternative hypothesis, Ha, tells us which area of the graph we are interested
in. Because the alternative hypothesis is μ<5.9, we are interested in the
region less than (to the left of) 5.9, so the correct graph is the first answer choice.
Your answer: wrong
Identify the null and alternative hypotheses
Question
A politician claims that at least 68% of voters support a decrease in taxes. A group
of researchers are trying to show that this is not the case. Identify the researchers'
null hypothesis, H0, and the alternative hypothesis, Ha, in terms of the
parameter p.
Select the correct answer below:
H0: p≤0.68; Ha: p>0.68
H0: p<0.68; Ha: p≥0.68
H0: p>0.68; Ha: p≤0.68
H0: p≥0.68; Ha: p<0.68
, Perform and interpret a hypothesis test for a proportion using Technology - Excel
Question
Steve listens to his favorite streaming music service when he works out. He
wonders whether the service's algorithm does a good job of finding random songs
that he will like more often than not. To test this, he listens to 50 songs chosen by
the service at random and finds that he likes 32 of them.
Use Excel to test whether Steve will like a randomly selected song more often than
not, and then draw a conclusion in the context of the problem. Use α=0.05.
Select the correct answer below:
Reject the null hypothesis. There is sufficient evidence to conclude that Steve will
like a randomly selected song more often than not.
Reject the null hypothesis. There is insufficient evidence to conclude that Steve will
like a randomly selected song more often than not.
Fail to reject the null hypothesis. There is sufficient evidence to conclude that Steve
will like a randomly selected song more often than not.
Fail to reject the null hypothesis. There is insufficient evidence to conclude that
Steve will like a randomly selected song more often than not.
Great work! That's correct. Correct answer:
Reject the null hypothesis. There is sufficient evidence to conclude that Steve will
like a randomly selected song more often than not.
Step 1: The sample proportion is pˆ=3250=0.64, the hypothesized proportion
is p0=0.5, and the sample size is n=50.
Step 2: The test statistic, rounding to two decimal places,
is z=0.64−0.50.5(1−0.5)50‾‾‾‾‾‾‾‾‾‾‾‾√≈1.98.
Step 3: Since the test is right-tailed, entering the
function =1−Norm.S.Dist(1.98,1) into Excel returns a p-value, rounding to three
decimal places, of 0.024.
Step 4: Since the p-value is less than α=0.05, reject the null hypothesis. There is
sufficient evidence to conclude that Steve will like a randomly selected song more
often than not.
Null and alternative hypothesis:
H0: p = 0.5
Ha: p >= 0.5
Hypothesis Test for the Mean
Week 7 Assignment Hypothesis Test for the mean-Polution Standard Deviation known
Compute the value of the test statistic (z-value) for a hypothesis test for one population mean with a
known standard deviation
Question
Jamie, a bowler, claims that her bowling score is less than 168 points, on average.
Several of her teammates do not believe her, so she decides to do a hypothesis
test, at a 1% significance level, to persuade them. She bowls 17 games. The mean
score of the sample games is 155 points. Jamie knows from experience that the
standard deviation for her bowling score is 19 points.
H 0:
μ≥168; Ha: μ<168
α=0.01 (significance level)
What is the test statistic (z-score) of this one-mean hypothesis test, rounded to two
decimal places?
Provide your answer: Test statistic = -2.82
Correct answers:
Test statistic = −2.82
The hypotheses were chosen, and the significance level was decided on, so the next
step in hypothesis testing is to compute the test statistic. In this scenario, the
sample mean score, x¯=155. The sample the bowler uses is 17 games,
so n=17. She knows the standard deviation of the games, σ=19. Lastly, the
bowler is comparing the population mean score to 168points. So, this value
(found in the null and alternative hypotheses) is μ0. Now we will substitute the
values into the formula to compute the test statistic:
z0=x¯−μ0σn√=155−1681917√≈−134.608≈−2.82
So, the test statistic for this hypothesis test is z0=−2.82.
Distinguish between one- and two-tailed hypotheses tests and understand possible conclusions
Question
Which graph below corresponds to the following hypothesis test?
H0:μ≥5.9, Ha:μ<5.9
Answer Explanation
,Correct answer:
A normal curve is over a horizontal axis and is centered on 5.9. A vertical line
segment extends from the horizontal axis to the curve at a point to the left of 5.9.
The area under the curve to the left of the point is shaded.
The alternative hypothesis, Ha, tells us which area of the graph we are interested
in. Because the alternative hypothesis is μ<5.9, we are interested in the
region less than (to the left of) 5.9, so the correct graph is the first answer choice.
Your answer: wrong
Identify the null and alternative hypotheses
Question
A politician claims that at least 68% of voters support a decrease in taxes. A group
of researchers are trying to show that this is not the case. Identify the researchers'
null hypothesis, H0, and the alternative hypothesis, Ha, in terms of the
parameter p.
Select the correct answer below:
H0: p≤0.68; Ha: p>0.68
H0: p<0.68; Ha: p≥0.68
H0: p>0.68; Ha: p≤0.68
H0: p≥0.68; Ha: p<0.68
, Perform and interpret a hypothesis test for a proportion using Technology - Excel
Question
Steve listens to his favorite streaming music service when he works out. He
wonders whether the service's algorithm does a good job of finding random songs
that he will like more often than not. To test this, he listens to 50 songs chosen by
the service at random and finds that he likes 32 of them.
Use Excel to test whether Steve will like a randomly selected song more often than
not, and then draw a conclusion in the context of the problem. Use α=0.05.
Select the correct answer below:
Reject the null hypothesis. There is sufficient evidence to conclude that Steve will
like a randomly selected song more often than not.
Reject the null hypothesis. There is insufficient evidence to conclude that Steve will
like a randomly selected song more often than not.
Fail to reject the null hypothesis. There is sufficient evidence to conclude that Steve
will like a randomly selected song more often than not.
Fail to reject the null hypothesis. There is insufficient evidence to conclude that
Steve will like a randomly selected song more often than not.
Great work! That's correct. Correct answer:
Reject the null hypothesis. There is sufficient evidence to conclude that Steve will
like a randomly selected song more often than not.
Step 1: The sample proportion is pˆ=3250=0.64, the hypothesized proportion
is p0=0.5, and the sample size is n=50.
Step 2: The test statistic, rounding to two decimal places,
is z=0.64−0.50.5(1−0.5)50‾‾‾‾‾‾‾‾‾‾‾‾√≈1.98.
Step 3: Since the test is right-tailed, entering the
function =1−Norm.S.Dist(1.98,1) into Excel returns a p-value, rounding to three
decimal places, of 0.024.
Step 4: Since the p-value is less than α=0.05, reject the null hypothesis. There is
sufficient evidence to conclude that Steve will like a randomly selected song more
often than not.
Null and alternative hypothesis:
H0: p = 0.5
Ha: p >= 0.5