OMICS
What is OMICS
- Transcriptomics: Study of all mRNA transcripts
- Proteomics: Study of all proteins
Your role in ALCAM research
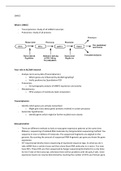
- Analyse micro array data (Transcriptomics)
o Which genes are influenced by ALCAM signalling?
o Verify positives by Quantitative-PCR
- Proteomics
o Gel zymography analysis of MMP2 expression and activity
- Metabolomics
o HPLC analysis of membrane lipid composition
Transcriptomics
- Identify which genes are actively transcribed
o Might give clues about gene/ proteins involved in certain processes
- Generates hypothesises
o Identify genes which might be further studied more closely
data generation
- There are different methods to look at many gene expression patterns at the same time.
- RNAseq = sequencing of isolated RNA molecules by 2nd generation sequencing method. You
sequence in one run billions of molecules. The sequenced fragments are aligned on the
genome. By counting the amount of sequenced RNA fragments per gene you know the gene
expression.
- EST sequencing literally means sequencing of expressed sequence tags. So what you do is
take mRNA from a certain tissue and then clone these RNA molecules in a vector. You now
have ESTs. These ESTs are then sequenced by Sanger sequencing Normally this is only done
for the 5’side of the transcript; otherwise there will be problems with the poly A tails. Gene
expression levels can now be determined by counting the number of ESTs you find per gene.
, - The advantages of this method are that you measure global levels of gene expression and
that is does not rely on previous sequence information necessary to construct primers or to
isolate gene specific RNA. The problem with the method lies in the fact that it is a lot of work
and sequencing is very expensive, because you have to sequence a lot of ESTs to get an idea
of the expression levels of low expressed genes, as there is not such a high concentration of
its mRNA
RNA-seq
- General information
o High throughput sequencing of RNA (next generation sequencing billions of
sequences per run)
o Count amount of fragments sequenced per gene to determine relative expression
level
o Measures global levels of gene expression
o Alignment with genome sequence
o Getting cheaper every day
- Method
o Isolate all the RNA in the gene
o To only get the mRNA the poly A tail on the end is captured
The poly A tail is located on the end of the mRNA
Bind to an magnetic bead to capture it
o Reverse transcription into cDNA + addition of adapters
RNA is to unstable
o high throughput (next gen) sequencing 30-400 bp of each fragment
o resulting reads aligned with reference genome / transcriptome
,Microarray ≈ multiple parallel Northern blots
- Northern blot: Only one gene
o With a northern blot you use a labelled gene specific probe (most of the times DNA)
to detect the presence of an RNA molecule on the blot.
- Microarray:
o A microarray is the other way around, where you use a labelled RNA or cDNA sample
to detect to which gene specific probes on the array it can bind. These probes
present on the array can either be complete or partial cDNAs or oligos.
- Incubate the cDNA with the probes (ss cDNA)
- Single stranded DNA from gene X
- Binding means colour because of fluorescent probe
- More genes can be incubated together
o Same concentrations
- Method
o Isolate RNA and take out mRNA
o Add fluophore
o Incubate samples
- Two types of microarrays:
o cDNA arrays
cDNA of different genes
o Oligonucleotide arrays
More focussed
cDNA microarrays
- Competitive hybridisation
o Overexpression of one gene
o One wins the competition -> colour shown
- Relative expression levels
- Look at ratios: gene expression
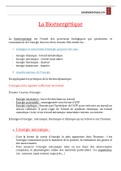
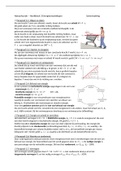
- A cDNA microarray is normally performed in such a way that you compare the gene
expression levels of two samples. Here sample A and sample B.
, - These RNA samples are turned into cDNA using labelled
nucleotides.
o In this way one sample is labelled green and the other
red.
- The two samples are then mixed and added to the slide where
they can hybridise.
o Because they are added at the same time you will get
competitive hybridisation.
- If the gene is expressed more in sample A than in B more green
label will bind than red label.
- If the gene is not expressed, nor in A or in B, then the spot will
stay black.
- The expression level of the gene is thus determined by looking at
the ratio between the two fluorescent dyes, resulting in a relative
expression level.
- The microarray is scanned twice, once for green and once for red.
- For a single array you have to compare red with green. For multiple arrays you have to
compare the ratios of red and green between the arrays.
Oligonucleotide microarrays
- Oligonucleotide microarrays work a little bit different. Here you only hybridise one labelled
sample to the probes on the array.
- cDNA binds to the oligo probes
- Compare the expression levels of genes
- When two genes are alike cross hybridization can occur
o cDNA binds each other’s spots
o Shows which parts of genes are alike and which part not alike to find the cross
hyberdisation
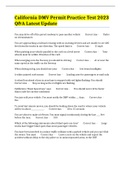
- These probes are oligonucleotides of around 25 nucleotides.
o A lot of probes need to be designed
- For every gene there is a set of oligos made in such a way that they are specific for that gene.
o So that you should be able to identify homologous genes or isoforms from one and
another.
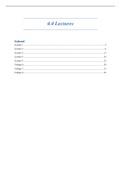
- Besides this set of perfectly matching oligos, there is also a set of mismatch oligos (aspecific
and cross hybridisation).
o The difference between these two sets is that in the mismatch oligos, the middle
nucleotide is changed, so when there is an A it will be changed into a T and when
there is a G it will be changed into a
C.
- The expression level for the gene is then
determined by taking the average
fluorescence intensity of the match probes
minus the average of the mismatch probes.
o White = strong hybridisation
o Black = no hybridisation.
What is OMICS
- Transcriptomics: Study of all mRNA transcripts
- Proteomics: Study of all proteins
Your role in ALCAM research
- Analyse micro array data (Transcriptomics)
o Which genes are influenced by ALCAM signalling?
o Verify positives by Quantitative-PCR
- Proteomics
o Gel zymography analysis of MMP2 expression and activity
- Metabolomics
o HPLC analysis of membrane lipid composition
Transcriptomics
- Identify which genes are actively transcribed
o Might give clues about gene/ proteins involved in certain processes
- Generates hypothesises
o Identify genes which might be further studied more closely
data generation
- There are different methods to look at many gene expression patterns at the same time.
- RNAseq = sequencing of isolated RNA molecules by 2nd generation sequencing method. You
sequence in one run billions of molecules. The sequenced fragments are aligned on the
genome. By counting the amount of sequenced RNA fragments per gene you know the gene
expression.
- EST sequencing literally means sequencing of expressed sequence tags. So what you do is
take mRNA from a certain tissue and then clone these RNA molecules in a vector. You now
have ESTs. These ESTs are then sequenced by Sanger sequencing Normally this is only done
for the 5’side of the transcript; otherwise there will be problems with the poly A tails. Gene
expression levels can now be determined by counting the number of ESTs you find per gene.
, - The advantages of this method are that you measure global levels of gene expression and
that is does not rely on previous sequence information necessary to construct primers or to
isolate gene specific RNA. The problem with the method lies in the fact that it is a lot of work
and sequencing is very expensive, because you have to sequence a lot of ESTs to get an idea
of the expression levels of low expressed genes, as there is not such a high concentration of
its mRNA
RNA-seq
- General information
o High throughput sequencing of RNA (next generation sequencing billions of
sequences per run)
o Count amount of fragments sequenced per gene to determine relative expression
level
o Measures global levels of gene expression
o Alignment with genome sequence
o Getting cheaper every day
- Method
o Isolate all the RNA in the gene
o To only get the mRNA the poly A tail on the end is captured
The poly A tail is located on the end of the mRNA
Bind to an magnetic bead to capture it
o Reverse transcription into cDNA + addition of adapters
RNA is to unstable
o high throughput (next gen) sequencing 30-400 bp of each fragment
o resulting reads aligned with reference genome / transcriptome
,Microarray ≈ multiple parallel Northern blots
- Northern blot: Only one gene
o With a northern blot you use a labelled gene specific probe (most of the times DNA)
to detect the presence of an RNA molecule on the blot.
- Microarray:
o A microarray is the other way around, where you use a labelled RNA or cDNA sample
to detect to which gene specific probes on the array it can bind. These probes
present on the array can either be complete or partial cDNAs or oligos.
- Incubate the cDNA with the probes (ss cDNA)
- Single stranded DNA from gene X
- Binding means colour because of fluorescent probe
- More genes can be incubated together
o Same concentrations
- Method
o Isolate RNA and take out mRNA
o Add fluophore
o Incubate samples
- Two types of microarrays:
o cDNA arrays
cDNA of different genes
o Oligonucleotide arrays
More focussed
cDNA microarrays
- Competitive hybridisation
o Overexpression of one gene
o One wins the competition -> colour shown
- Relative expression levels
- Look at ratios: gene expression
- A cDNA microarray is normally performed in such a way that you compare the gene
expression levels of two samples. Here sample A and sample B.
, - These RNA samples are turned into cDNA using labelled
nucleotides.
o In this way one sample is labelled green and the other
red.
- The two samples are then mixed and added to the slide where
they can hybridise.
o Because they are added at the same time you will get
competitive hybridisation.
- If the gene is expressed more in sample A than in B more green
label will bind than red label.
- If the gene is not expressed, nor in A or in B, then the spot will
stay black.
- The expression level of the gene is thus determined by looking at
the ratio between the two fluorescent dyes, resulting in a relative
expression level.
- The microarray is scanned twice, once for green and once for red.
- For a single array you have to compare red with green. For multiple arrays you have to
compare the ratios of red and green between the arrays.
Oligonucleotide microarrays
- Oligonucleotide microarrays work a little bit different. Here you only hybridise one labelled
sample to the probes on the array.
- cDNA binds to the oligo probes
- Compare the expression levels of genes
- When two genes are alike cross hybridization can occur
o cDNA binds each other’s spots
o Shows which parts of genes are alike and which part not alike to find the cross
hyberdisation
- These probes are oligonucleotides of around 25 nucleotides.
o A lot of probes need to be designed
- For every gene there is a set of oligos made in such a way that they are specific for that gene.
o So that you should be able to identify homologous genes or isoforms from one and
another.
- Besides this set of perfectly matching oligos, there is also a set of mismatch oligos (aspecific
and cross hybridisation).
o The difference between these two sets is that in the mismatch oligos, the middle
nucleotide is changed, so when there is an A it will be changed into a T and when
there is a G it will be changed into a
C.
- The expression level for the gene is then
determined by taking the average
fluorescence intensity of the match probes
minus the average of the mismatch probes.
o White = strong hybridisation
o Black = no hybridisation.