Lab session 1: Assignment 1: Introduction to SPSS
File > open > data
After opening the data file, you will see two tabs at the bottom-left of your SPSS screen. Make sure you are looking at the
Variable View tab. The variable view gives an overview of the variables in the data set. Each row in the variable view
represents a variable. The columns describe the properties of the variable. This includes the following:
• Name: A technical name for the variable. It’s an unique variable name to be used by SPSS. It has some restrictions
(e.g., may contain no blanks, should start with a letter, no special signs (e.g., %), and can have a limited number
of characters). Think of an SNR for a student. It’s a technical code that we use in our administration system for
your results (See more details about names under the info button).
• Label: A label is a description of the variable. Think of the student’s name. The label doesn’t have to be unique,
but of course it is not very convenient to use the same label for different variables.
The difference between the name and the label is as follows: the name is a (short) technical code for the variable. It should
be unique. The label is a description of the variable, which will also appear in the output. So, it’s important to use
meaningful labels, so it makes reading and understanding the output easier for you and your fellow researchers.
• Values: values are relevant if you have nominal or ordinal variables. For each value you can specify a label that
describes the meaning of the value (so called value labels).
• Measure: it specifies the measurement level. We distinguish between three levels: nominal, ordinal, and scale.
The Data View tab shows the scores on all variables for all cases (participants) in the dataset. At the top of each column,
it says which variable it shows. Each line represents one participant.
Lab session 1: Assignment 2: Descriptive Statistics
The first step in any statistical analysis involves inspection of the data at hand by means of descriptive statistics and
graphical summaries. This includes descriptive statistics such as the mean, standard deviation, minimum and maximum
value, amongst others. Graphical summaries include scatter plots, bar charts, and histograms.
Generate the descriptive statistics
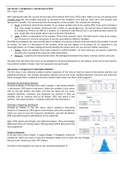
Proceed as follows: In the top menu, select: analyze -> descriptive statistics
-> descriptives. SPSS opens a new menu. Select the variables. In this menu,
click on the tab options and make sure that the boxes for the mean,
standard deviation, minimum, and maximum are checked. If they are
checked, click on continue and on OK (Paste). SPSS now opens a new
window - the output window - including a table with the descriptives.
Generate a frequency distribution
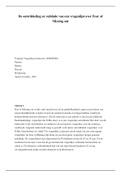
Proceed as follows: In the top menu, select: Analyze→ Descriptive
Statistics→ Frequencies. SPSS opens a new window. Select the variables for
which you want to have the frequency distribution and click OK (Paste).
SPSS now adds frequency distributions in the output file.
Note: SPSS reports percentages and valid percentages. These percentages
differ when there are missing values. Missing values will be discussed in the
next assignment.
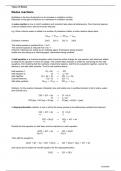
Create a histogram
In the top menu, select: Graphs → Legacy Dialogs → Histogram. Select the
variable for which you want to have the histogram Make sure to check the box “Display
Normal Curve” before you click “OK” (Paste).
The data in the histogram are more or less normally distributed →
, Erroneous values
One of the reasons to take a good look at descriptive statistics before doing real analyses, is to check whether there are
erroneous values in the data file. For example, a person may have mistyped his/her age (e.g. 511 instead of 51) or a score
was mistyped while copying data from a pen-and-paper survey into SPSS (e.g. a score of 23 may appear on a scale of 1-
10). Generate the frequencies and descriptive statistics for variables to check whether there are erroneous values or not.
When you have found “out of range” values, the next step is to find the cases that have these values, and, if you wish so,
remove these values from your dataset. To easily find the cases that have missing values, you may sort the data from high
to low. This can be done as follows: In the top menu, select: Data -> sort cases. Then select the variable on which cases
should be sorted and whether they should in ascending (oplopend, laag → hoog) or in descending order (aflopend, hoog
→ laag). Then click on OK. Go the data view and verify that the cases are now ordered in the way you asked for. Remove
the score(s) (i.e., delete the scores(s) from the data file) that have invalid values. MIND YOU: do NOT remove the entire
case or row from the dataset!
Descriptives per group (Split file)
In the top menu, select: Data → Split File → Compare Groups.
Now select the groups based on the variable. Click OK (Paste).
(Notice that you don’t see any changes in the data file or output
yet. Nevertheless, from now on SPSS will do the analyses per
group. So just continue with the next step, and you will see what
the split file does).
Undo the split file option
Proceed as follows: In the top menu, select: data -> split file. Now select “analyze all cases, do not create groups”, and
click OK (Paste).
Lab session 1: Assignment 3: Missing values
Missing values can occur for all kind of reasons. Respondents may refuse to give answers, did not understand the question
and therefore refrain from answering the question, or simply overlook a question. Whatever the reason, it is important
that missing data are adequately handled in the data analysis!
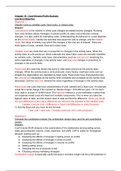
Note that the values in the columns “Percentage” and " Valid
percentage" differ. This is due to these missing values!
“Percentage” is obtained by dividing the observed frequency by
the total N (including respondents with a missing value), whereas
“Valid Percentage” is obtained by dividing the observed frequency
by the number of respondents with a valid score (thus, excluding
the persons who had a missing value).
In the current dataset, the missing values are just empty cells. SPSS sees the empty cells as so called “system missing”. It
simply tells us that data in these cells are missing. Although this may work for now, a better strategy is to use codes for
the missing values. For example, we may code our current missing values by 999.
Code current missing values
Go to the data view and fill in the value 999 for the missing values on the variable stress. (You may want to use the “sort
cases” option to find the missing values faster). Go to the variable view, look for the column “missing”, and click on this
column for the variable stress. A new window opens. Specify 999 as a discrete missing value. SPSS now knows that the
value 999 stands for “missing observation”. By doing this, you told SPSS that you are aware of the fact that there is no
observation on this variable for some of the respondents and that the cells are not just empty by mistake! The importance
of using codes for missing values is that there may be different reasons for a value to be missing. For example, a respondent
may give an invalid answer (e.g. (s)he did respond but the answer is useless, the answer was unreadable, or (s)he did not
respond at all). In this case, you may want to use different codes for different types of missing. Later on in the output you
can easily see the frequencies for the different types of missingness. By doing so, even the missing values are informative!
File > open > data
After opening the data file, you will see two tabs at the bottom-left of your SPSS screen. Make sure you are looking at the
Variable View tab. The variable view gives an overview of the variables in the data set. Each row in the variable view
represents a variable. The columns describe the properties of the variable. This includes the following:
• Name: A technical name for the variable. It’s an unique variable name to be used by SPSS. It has some restrictions
(e.g., may contain no blanks, should start with a letter, no special signs (e.g., %), and can have a limited number
of characters). Think of an SNR for a student. It’s a technical code that we use in our administration system for
your results (See more details about names under the info button).
• Label: A label is a description of the variable. Think of the student’s name. The label doesn’t have to be unique,
but of course it is not very convenient to use the same label for different variables.
The difference between the name and the label is as follows: the name is a (short) technical code for the variable. It should
be unique. The label is a description of the variable, which will also appear in the output. So, it’s important to use
meaningful labels, so it makes reading and understanding the output easier for you and your fellow researchers.
• Values: values are relevant if you have nominal or ordinal variables. For each value you can specify a label that
describes the meaning of the value (so called value labels).
• Measure: it specifies the measurement level. We distinguish between three levels: nominal, ordinal, and scale.
The Data View tab shows the scores on all variables for all cases (participants) in the dataset. At the top of each column,
it says which variable it shows. Each line represents one participant.
Lab session 1: Assignment 2: Descriptive Statistics
The first step in any statistical analysis involves inspection of the data at hand by means of descriptive statistics and
graphical summaries. This includes descriptive statistics such as the mean, standard deviation, minimum and maximum
value, amongst others. Graphical summaries include scatter plots, bar charts, and histograms.
Generate the descriptive statistics
Proceed as follows: In the top menu, select: analyze -> descriptive statistics
-> descriptives. SPSS opens a new menu. Select the variables. In this menu,
click on the tab options and make sure that the boxes for the mean,
standard deviation, minimum, and maximum are checked. If they are
checked, click on continue and on OK (Paste). SPSS now opens a new
window - the output window - including a table with the descriptives.
Generate a frequency distribution
Proceed as follows: In the top menu, select: Analyze→ Descriptive
Statistics→ Frequencies. SPSS opens a new window. Select the variables for
which you want to have the frequency distribution and click OK (Paste).
SPSS now adds frequency distributions in the output file.
Note: SPSS reports percentages and valid percentages. These percentages
differ when there are missing values. Missing values will be discussed in the
next assignment.
Create a histogram
In the top menu, select: Graphs → Legacy Dialogs → Histogram. Select the
variable for which you want to have the histogram Make sure to check the box “Display
Normal Curve” before you click “OK” (Paste).
The data in the histogram are more or less normally distributed →
, Erroneous values
One of the reasons to take a good look at descriptive statistics before doing real analyses, is to check whether there are
erroneous values in the data file. For example, a person may have mistyped his/her age (e.g. 511 instead of 51) or a score
was mistyped while copying data from a pen-and-paper survey into SPSS (e.g. a score of 23 may appear on a scale of 1-
10). Generate the frequencies and descriptive statistics for variables to check whether there are erroneous values or not.
When you have found “out of range” values, the next step is to find the cases that have these values, and, if you wish so,
remove these values from your dataset. To easily find the cases that have missing values, you may sort the data from high
to low. This can be done as follows: In the top menu, select: Data -> sort cases. Then select the variable on which cases
should be sorted and whether they should in ascending (oplopend, laag → hoog) or in descending order (aflopend, hoog
→ laag). Then click on OK. Go the data view and verify that the cases are now ordered in the way you asked for. Remove
the score(s) (i.e., delete the scores(s) from the data file) that have invalid values. MIND YOU: do NOT remove the entire
case or row from the dataset!
Descriptives per group (Split file)
In the top menu, select: Data → Split File → Compare Groups.
Now select the groups based on the variable. Click OK (Paste).
(Notice that you don’t see any changes in the data file or output
yet. Nevertheless, from now on SPSS will do the analyses per
group. So just continue with the next step, and you will see what
the split file does).
Undo the split file option
Proceed as follows: In the top menu, select: data -> split file. Now select “analyze all cases, do not create groups”, and
click OK (Paste).
Lab session 1: Assignment 3: Missing values
Missing values can occur for all kind of reasons. Respondents may refuse to give answers, did not understand the question
and therefore refrain from answering the question, or simply overlook a question. Whatever the reason, it is important
that missing data are adequately handled in the data analysis!
Note that the values in the columns “Percentage” and " Valid
percentage" differ. This is due to these missing values!
“Percentage” is obtained by dividing the observed frequency by
the total N (including respondents with a missing value), whereas
“Valid Percentage” is obtained by dividing the observed frequency
by the number of respondents with a valid score (thus, excluding
the persons who had a missing value).
In the current dataset, the missing values are just empty cells. SPSS sees the empty cells as so called “system missing”. It
simply tells us that data in these cells are missing. Although this may work for now, a better strategy is to use codes for
the missing values. For example, we may code our current missing values by 999.
Code current missing values
Go to the data view and fill in the value 999 for the missing values on the variable stress. (You may want to use the “sort
cases” option to find the missing values faster). Go to the variable view, look for the column “missing”, and click on this
column for the variable stress. A new window opens. Specify 999 as a discrete missing value. SPSS now knows that the
value 999 stands for “missing observation”. By doing this, you told SPSS that you are aware of the fact that there is no
observation on this variable for some of the respondents and that the cells are not just empty by mistake! The importance
of using codes for missing values is that there may be different reasons for a value to be missing. For example, a respondent
may give an invalid answer (e.g. (s)he did respond but the answer is useless, the answer was unreadable, or (s)he did not
respond at all). In this case, you may want to use different codes for different types of missing. Later on in the output you
can easily see the frequencies for the different types of missingness. By doing so, even the missing values are informative!