Multivariate Data Analysis
Lecture 1
Relationship between several variables (three or moremultivariate)
One dependent variable; several independent variables (predictors)
Which technique is used depends on measurement level of variables (nominal, interval,
binary)
#
Residual=difference bw predicted and actual score
Best prediction is if sum of squared differences is minimal (residuals are minimalnot much
error)
Constant=where line crosses y-axis
With two predictors=regression line becomes regression plane
Use regression model to predict someone’s score
Evaluating the model:
Hypothesis testing if we reject H0, we know that at least one regression coefficient has a
predictive value
R squared = how good model reflects observed data
Through standardizing the regression equation, measurement units do not matter
Semipartial corr (squared part correlations in SPSS) reflects how much var uniquely
explained by one variable
o 3.4% explained by both predictors
o r2 = 0.500 = 50%
50-28.3-18.3=3.4
Regression Assumptions
, o Interval measurement level
o Dep variable is linear combination of predictors
o Homoscedasticity of residuals (constant across values of predictors)
o Independence of residuals
o Normality of residuals
o No multicollinearity in predictors (inter-correlations)
Checking assumptions in SPSS
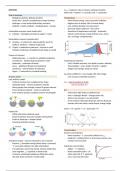
Residual Plot: normal distr. of residuals!
Check Outliers
Different types of outliers
k=number of predictors
What if assumptions are violated?
o Easy fixes:
Remove predictors that cause violation (often not possible)
Try transforming the variables (not always works)
o Better:
Use a more robust regression technique
Multicollinearity
o Moderate to high inter-corr among predictors
Limits size of r2
How important is predictor?
Unstable regression equation
o Identifying Multicoll.:
Tolerance needs to be above 0.10
VIF needs to be below 10
Lecture 1
Relationship between several variables (three or moremultivariate)
One dependent variable; several independent variables (predictors)
Which technique is used depends on measurement level of variables (nominal, interval,
binary)
#
Residual=difference bw predicted and actual score
Best prediction is if sum of squared differences is minimal (residuals are minimalnot much
error)
Constant=where line crosses y-axis
With two predictors=regression line becomes regression plane
Use regression model to predict someone’s score
Evaluating the model:
Hypothesis testing if we reject H0, we know that at least one regression coefficient has a
predictive value
R squared = how good model reflects observed data
Through standardizing the regression equation, measurement units do not matter
Semipartial corr (squared part correlations in SPSS) reflects how much var uniquely
explained by one variable
o 3.4% explained by both predictors
o r2 = 0.500 = 50%
50-28.3-18.3=3.4
Regression Assumptions
, o Interval measurement level
o Dep variable is linear combination of predictors
o Homoscedasticity of residuals (constant across values of predictors)
o Independence of residuals
o Normality of residuals
o No multicollinearity in predictors (inter-correlations)
Checking assumptions in SPSS
Residual Plot: normal distr. of residuals!
Check Outliers
Different types of outliers
k=number of predictors
What if assumptions are violated?
o Easy fixes:
Remove predictors that cause violation (often not possible)
Try transforming the variables (not always works)
o Better:
Use a more robust regression technique
Multicollinearity
o Moderate to high inter-corr among predictors
Limits size of r2
How important is predictor?
Unstable regression equation
o Identifying Multicoll.:
Tolerance needs to be above 0.10
VIF needs to be below 10