Stat week 1 tot 4
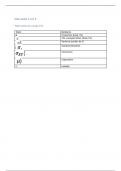
Tabel tekens & overige info:
Teken Betekenis
𝜋 Proportion (total / N)
The (sample) Mean (Total / N)
Variance (zonder de C)
Standard deviation
Covariance
Expectation
𝜆 Lambda
,1.1 Data
A few facts about data:
- Data is put into a Data Matrix or Data frame (excel)
- Colums -> Variables / Rows -> subjects/cases / Cells -> observations of a variable for that
specific subject/case
Data Types
A few examples from the exercises:
Categorical or Discrete/continuous numerical.
What is it? Data type
Manufacturer of your car Categorical
College major Categorical
Number of college credits Discrete numerical
Length of a TV commercial Continuous numerical (time can be 0.0001)
Number of peanuts in a can Discrete numerical
Flight time Continuous numerical
Grams of Fat Continuous numerical
To remember:
- What you can write out: Categorical
- Can you count it/ is It an integer -> Discrete numerical.
- Can it be an interval/decimal -> Continuous numerical.
Measurement level:
There are 4 measurement levels: Nominal, ordinal, interval and ratio. There is an easy way to
determine which type the data is:
Is there order or is it useful?
No-> Nominal, yes->
Are there meaningful differences?
No? Ordinal, yes->
Do you have a meaningful zero point?
No? Interval, yes -> Ratio
Here a few examples:
What is it? Measurement level
Number of hits in a game Ratio-> 0 hits is possible
Freeway traffic (medium, light, heavy) Ordinal-> there is an ranking
Number of employees in a random store Ratio-> can be zero
Temperature Interval-> 0 is just a temperature
Salary of a guy Ratio-> can be 0
Managers rating Ordinal
Social Security number Nominal
Data can be replaced by number, but you cannot calculate with those numbers!
Let’s say: car;1, bike; 2, train;3. When car+bike = 3, it does not turn into a train.
,Missing data:
- Missing data is practical; blank, Nan, 0, -999.
- Deal with this appropriately -> mean for income, most frequent for favorite video
game.
1.1.2Summarizing data
Median-> middle
Midrange-> biggest – smallest
Geometric mean: wortel van alles x elkaar
Calculate by: 9 x wortel functie en dan de x1 etc tussen haakjes
Population: the collection of all possible data points (all people in the Netherlands
Sample: a subset of data taken from the population (survey)
- Sample has an aspect of randomness -> it could have been different.
That is where the element of statistical analysis kicks in:
- We need a model to describe what could have been.
- We need tools to confront wat could have been with what we observed, and what we
observed was at odds with the model.
- If it is at odds, we conclude the model (theory) is Rejected by the data.
Downside of a sample: because the group is small, you can have multiple completely different
answers when calculating the proportion.
Sample proportion P: Total/N (N is sample or population size)
Population proportion: 𝜋
, NUMMERICAL VARIABLES: ALLEMAAL OP FORMULE BLAD OP K% na
Sample mean: ->
(total/N)
Sample median: M=0.5(n+1)
Mid-Range: the average of the minimum and maximum observation.
Range: largest-smallest (speekt voor zich)
Interquartile Range: Range of the middle 50% (ignore top 25 and bottom 25-> 1248 -> only 2
and 4). IQR=q3-q1 q3=0.75 (75%) x N, afronden omhoog -> (middelste stukje van boxplot)
Geometric mean: -> op formule blad geen wortel maar tot
de macht 1/n wat natuurlijk wortel is.
Example:
Number of internet users grew from 78.5 million in 2000 to 156.6 million in 2010, find the
mean annual growth rate:
Example 2:
For when you have a data set.
Trimmed mean:

