Iqr - Study guides, Class notes & Summaries
Looking for the best study guides, study notes and summaries about Iqr? On this page you'll find 371 study documents about Iqr.
Page 3 out of 371 results
Sort by
-
AP Statistics Final Exam Review 2023-2024 Questions With Complete Solutions
- Exam (elaborations) • 9 pages • 2023
- Available in package deal
-
- CA$15.37
- + learn more
Categorical Data correct answer: Assigns a unique value for each case, used to name or identify it Quantitative Data correct answer: A variable in which the numbers act as a numerical value, always have units Stem and leaf plot correct answer: Shows quantitative data values in a way that sketches the distribution of the data Ogive correct answer: a graph that represents the cumulative frequencies for the classes in a frequency distribution Histogram correct answer: Bar graphing ...
-
D467 Exploring Data Questions and Answers Already Passed
- Exam (elaborations) • 14 pages • 2024
- Available in package deal
-
- CA$13.97
- + learn more
D467 Exploring Data Questions and Answers Already Passed What is the purpose of data exploration in data analysis? Data exploration aims to summarize the main characteristics of a dataset, often using visual methods to uncover patterns, trends, and anomalies. What is the difference between qualitative and quantitative data? Qualitative data describes categorical variables and characteristics, while quantitative data represents numerical values that can be measured and analyzed sta...
-
STAT 503 FINAL EXAM QUESTIONS AND ANSWERS
- Exam (elaborations) • 4 pages • 2024
-
- CA$14.67
- + learn more
Is a quantitative variable always measured in numbers? - Answer-Yes Is any measurement that you record from a sample a variable? - Answer-False What is a statistic? - Answer-The measure that is taken from the whole sample as a summary of the sample Sample data skewed to the left, then longer tail is at the... - Answer-Left What is sensitive to outliers? - Answer-Median Formula to calculate standard deviation - Answer-s = sqrt(sum(x1-xbar)^2 / n-1) How to calculate degrees of fr...
-
WGU C955 Applied Probability and statistics Exam Study Guide
- Exam (elaborations) • 15 pages • 2024
-
- CA$11.19
- + learn more
Pie chart numerical measure: percentages best used When displaying categories as parts of the whole Bar chart (bar graph) Category counts or frequencies best used when displaying counts or frequencies for each category individually Dot Plot 5-number summary (max, Q1, median, Q3, max) Smaller data set; useful to display the distribution and show gaps and outliers (quantitative) Stem Plot (stem-and-leaf plot) 5-number summary (max, Q1, median, Q3, max) Smaller data sets; useful to disp...
-
Basic Statistics and Epidemiology for CTR Exam (Latest 2023/2024) Actual Questions and Answers 100% Correct
- Exam (elaborations) • 13 pages • 2023
-
- CA$19.57
- + learn more
Basic Statistics and Epidemiology for CTR Exam (Latest 2023/2024) Actual Questions and Answers 100% Correct 1. Measures of central tendency Answer: mean, median, mode 2. Measures of variability or dispersion Answer: range, variance, standard deviation andinterquartile range (IQR) 3. Measures of Shape Answer: skewness, symmetric (normal curve or bell curve), andbimodal 4. Skewness Answer: Degree of asymmetry in a distribution Positive - Tail extending out to right (larger numbers)Neg...
-
AP Stats Exam Review Questions And Answers With Complete Solutions
- Exam (elaborations) • 10 pages • 2023
- Available in package deal
-
- CA$15.37
- + learn more
What is needed for all Stemplots? correct answer: Key showing how to read the plot What is in the 5 number summary? correct answer: minimum, Q1, median, Q3, maximum How do you calculate IQR? correct answer: Q3-Q1 - IQR is a number, not a range What does VSCO stand for? correct answer: variability, shape, center, outliers WHAT DO YOU NEED FOR FULL POINTS? correct answer: CONTEXT "Describe the distribution" = correct answer: = VSCO + Context When describing shape without...

-
C207 EXAM QUESTIONS AND ANSWERS
- Exam (elaborations) • 12 pages • 2023
-
- CA$17.47
- + learn more
1. Which of the following statistics are unaffected by a single large outlier? (More than one) * - Answer- Median, mode, Interquartile range (IQR) 2. Which of the following is most suitable for policy making based on income distribution? * - Answer- Median Because of assumed skewed distribution 3. If we study data from a population whose mean is 200 and standard deviation is 30, which of the following data points has a z-score of -3? * - Answer- 110. 4. Which of the following statist...
-
UGBA 104 M1 Exam 2023 Questions and Answers
- Exam (elaborations) • 5 pages • 2023
- Available in package deal
-
- CA$14.67
- + learn more
UGBA 104 M1 Exam 2023 Questions and Answers calculate outliers IQR method - ️️ IQR below; Q1 - 1.5 * IQR IQR above; Q3 + 1.5 * IQR how to calculate percentiles - ️️ percentile (L) = (n+1) * P/100 calculate z score outlier - ️️ (value-mean)/SD rule of thumb for z score outlier - ️️ above or below 3 SDs away which outlier method is more lenient - ️️ z score, it goes further from mean than the IQR method ie the IQR gives a z score less than 3 cross tabulation - ️️ a...
-
Probability and Statistics, WGU C955 | 51 Questions and answers with 100% correct solutions | Graded A+
- Exam (elaborations) • 6 pages • 2024
-
- CA$11.18
- + learn more
Boxplot an image that has min, Q1, median, Q3, max Histogram A graphical representation -- bars, measuring the frequency within each interval Skewed right Not a symmetric distribution, the tail is on the right, i.e. extra stuff on the right Measures of center Median, the mean (and mode) Measures of spread Range, IQR & standard deviation Standard Deviation Rule 68% of the data are within 1 standard deviation, 95% are within 2, 99.7 are within 3 standard deviations from the mean. For skewed...
-
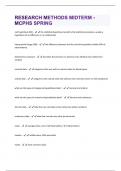
RESEARCH METHODS MIDTERM - MCPHS SPRING QUESTIONS & ANSWERS VERIFIED 100% CORRECT!!
- Exam (elaborations) • 8 pages • 2024
- Available in package deal
-
- CA$11.18
- + learn more
null hypothesis (H0) - the statistical hypothesis tested by the statistical procedure; usually a hypothesis of no difference or no relationship Interquartile Range (IQR) - the difference between the first and third quartiles (middle 50% of observations) dichotomous measure - describes the presence or absence of an attribute (ex smoker/nonsmoker) nominal data - categories that vary with no natural order (ex blood types) ordinal data - categories with natural order but without clear units (e...

How much did you already spend on Stuvia? Imagine there are plenty more of you out there paying for study notes, but this time YOU are the seller. Ka-ching! Discover all about earning on Stuvia


