Exam (elaborations)
Test Bank Discovering Statistics 3rd Edition by Larose
- Module
- Statistics
- Institution
- Oxford University (OX)
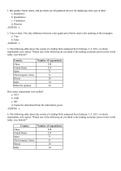
1. Bar graphs, Pareto charts, and pie charts are all graphical devices for displaying what type of data? a. Qualitative b. Quantitative c. Continuous d. Discrete ANSWER: a 2. True or false: The only difference between a bar graph and a Pareto chart is the ordering of the rec...
[Show more]