Unit 8 – using statistics in science
P1 - Carry out statistical calculations to investigate a scientific problem
D1 - Interpret shapes if distribution in scientific date
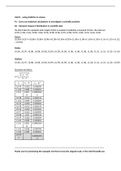
The time it takes for a pendulum with a length of 30cm to complete 10 oscillations is measured 15 times. The results are:
10.99s, 11.00s, 11.01s, 10.98s, 11.00s, 10.99s, 10.98s, 10.96s, 10.97s, 10.98s, 10.99s, 11.00s, 11.01s, 11.02s, 11.00s
Mean:
10.96+10.97+10.98+ 10.98+ 10.98+10.99+10.99+10.99+11.00+11.00+11.00+11.00 +11.01+11.01+11.02
¿ 10.992
Mode:
10.96 , 10.97 ,10.98 , 10.98 , 10.98 ,10.99 , 10.99 ,10.99 , 11.00 , 11.00 , 11.00 , 11.00 , 11.01 ,11.01 ,11.02=11.00
Median:
10.96 , 10.97 ,10.98 , 10.98 , 10.98 ,10.99 , 10.99 ,10.99 , 11.00 , 11.00 , 11.00 , 11.00, 11.01,11.01 ,11.02=10.99
Standard deviation:
2
σ=
√
Σ ( x i−x )
n−1
xi x i−x 2
( x i−x )
10.99 -0.002 0.000004
11.00 0.008 0.000064
11.01 0.001 0.0000032
8 4
10.98 -0.012 0.000144
11.00 0.008 0.000064
10.99 -0.002 0.000004
10.98 -0.012 0.000144
10.96 -0.032 0.001024
10.97 -0.022 0.000484
10.98 -0.01 0.000144
10.99 -0.002 0.000004
11.00 0.008 0.000064
11.01 0.001 0.0000324
8
11.02 0.028 0.000784
11.00 0.008 0.000064
10.99
0.0030276
2
4
…………………………………………………………………………………………………………………………………………………….
Thank you for previewing the example, feel free to buy the singular task, or the Unit 8 bundle xxx


