Tables:
Figure 1:
Revenue:
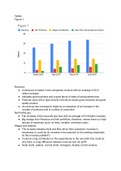
● Continuous increase in the companies revenue with an average of £2.6
million increase
● Indicates good business and a good about of sales of products/services
● Premium price with a high amount of revenue shows good business and good
quality product.
● As revenue has increased it might be an indication of an increase in the
number of products sold or number of customers
Net Profit/Loss:
● Fair increase of the net profit and loss with an average of £4.4million increase
● Big change from Revenue and Net profit/loss, therefore, means there is a high
amount of expenses (such as fixed, variable, overhead costs)
Wages and salaries:
● The increase between April and May which then sustained- Increase in
employees or could be an increase in the payment to the existing employees
(is this increase justified?)
● Could be a big contribution to the expenditures in the net profit- this could be
why there is a big difference between revenue and net profit
● Head chefs, waiters, normal chefs, managers, Quality control workers.


