In this document you will find a short summary for the course “Intermediate Corporate Finance”, given in the third year of the bachelor's degree in Economics and Business Economics and in the Pre-Master Finance. The summary contains the main substance from weeks 1 to 4, as well as a small part ...
NPV Investment Rule: When making an investment decision, take the alternative with the highest NPV.
Choosing this alternative is equivalent to receiving its NPV in cash today. (Only accept if 𝑁𝑃𝑉 > 0).
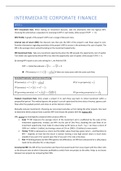
NPV Profile: A graph of the project’s NPV over a range of discount rates.
Internal rate of return (IRR): the discount rate that sets the NPV of the project’s cash flows equal to zero.
Provides information regarding sensitivity of the project’s NPV to errors in the estimate of its cost of capital. The
IRR is the average return earned by taking on the investment opportunity.
IRR Investment Rule: Take any investment opportunity when the IRR exceeds the opportunity cost of capital.
Turn down any opportunity whose IRR is less than the opportunity cost of capital. (Only accept if 𝐼𝑅𝑅 > 𝑟).
By setting NPV equal to zero and solving for 𝑟, we find the 𝐼𝑅𝑅:
𝐶𝐹1 𝐶𝐹𝑁
𝑁𝑃𝑉 = Initial Investment + +⋯+ =0
𝑟 𝑟
1 1
➔ 𝑃𝑉(𝑎𝑛𝑛𝑢𝑖𝑡𝑦) = 𝐶 × (1 − (1+𝑟)𝑛) if there are many years with the same cash flow.
𝑟
Payback Investment Rule: Only accept a project if its cash flows pay back its initial investment within a
prespecified period. This method ignores the project’s cost of capital and the time value of money, ignores cash
flows after the payback period, and relies on ad hoc decision criteria. ‘
Mutually exclusive investments: Choosing any one project excludes us from taking the other projects. We need
to determine which projects have a positive NPV and choose the project with the highest NPV.
IRRs cannot be meaningfully compared when projects differ in:
1. Scale → IRR measures the average return of the investment and is unaffected by the scale of the
investment opportunity. Instead, use NPV: by the Law of One Price, doubling the cash flows of an
investment opportunity must make its value today worth twice as much. E.g., I can have a return of
100% on 1 dollar (=1 dollar), but having a return of 1% on 1000 (= 10 dollars) is more worth.
2. Timing → IRR is expressed as a return, but the dollar value of earning a given return – and therefore its
NPV – depends on how low the return is earned. Earning a very high annual return is much more
valuable if you earn it for several years than if you earn it for only a few days.
3. Risk → Ranking projects by their IRRs ignores risk differences: an IRR that is attractive for a safe project
need not be attractive for a risky project.
Incremental IRR: the IRR of the incremental cash flows that would result from one project with the other; tells
us the discount rate at which it becomes profitable to switch from one project to the other. Helps us to choose
between two projects by comparing their IRRs.
,Profitability index: ratio of the project’s NPV to its initial investment; tells us that for every dollar invested in a
Value Created 𝑁𝑃𝑉
project, we will generate …$ in value. Profitability Index = =
Resource Consumed Resource Consumed
Capital budget: lists the projects and investments that a company plans to undertake during the coming year.
Capital budgeting: analysing projects and deciding which ones to accept to determine the firm’s capital budget.
This process begins with forecasts of the project’s future consequences for the firm.
The first step in capital budgeting is to determine the incremental earnings of a project → the amount by which
the firm’s earnings are expected to change as a result of the investment decision.
1. Review the revenue and cost estimates for the firm:
Incremental Revenue/Cost = Number of Units × Price per Unit
2. Then deduct the depreciation expense. Most often used is straight line method:
Purchase Price−Salvage Value
Depreciation Expense =
Estimated Useful Life
3. Calculate the incremental income tax expense:
Income Tax = 𝐸𝐵𝐼𝑇 × 𝜏𝑐
4. Unlevered net income indicates that it does not include any interest expenses associated with debt; it
is equal to its incremental revenues less costs and depreciation, evaluated on an after tax basis:
Unlevered Net Income = 𝐸𝐵𝐼𝑇 × (1 − 𝜏𝑐 ) = (Revenues − Costs − Depreciation) × (1 − 𝜏𝑐 )
Opportunity cost: the value a resource could have provided in its best alternative use. Because this value is lost
when the resource is used by another project, we should include the opportunity cost as an incremental cost of
the project.
Externalities: indirect effects of the project that may increase/decrease the profits of other business activities
of the firm.
Cannibalization: Sales of a new product displace sales of an existing product.
Sunk cost: any unrecoverable cost for which the firm is already liable; sunk costs have been or will be paid
regardless of the decision about whether or not to proceed with the project, e.g., research and development
investment. → If our decision does not affect the cash flow, then the cash flow should not affect our decision.
Overhead expenses: expenses associated with activities not directly attributable to a single business activity but
instead affect many different areas of the corporation. To the extent that overhead costs are fixed and will be
incurred in any case, they are not incremental to the project and should not be included. Only include as
incremental expenses the additional overhead expenses that arise because of the decision to take on project.
Sunk cost fallacy: the tendency of people to be influenced by sunk costs and invest in projects that have negative
NPVs because they have already invested large amounts in the project and feel that by not continuing it, the
prior investment will be wasted.
The second step in the capital budgeting decision making, is to determine consequences for the firm’s available
cash. The free cash flow is the incremental effect of a project on the firm’s available cash, separate from any
financing decisions. Important differences cash flow and earnings: cash flows do not include non-cash charges
(depreciation), but do include the cost of capital investment.
1. Depreciation
2. NWC = Current Assets − Current Liabilitie = Cash + Inventory + Receivables − Payables
Unlevered Net Income
3. Free Cash Flow = ⏞
(Revenues − Costs − Depr) × (1 − 𝜏𝐶 ) + Depr − CapEx − ∆𝑁𝑊𝐶 =
Free Cash Flow = (Revenues − Costs) × (1 − 𝜏𝐶 ) − CapEx − ∆𝑁𝑊𝐶 + 𝜏𝐶 × Depreciation
, a. 𝜏𝐶 × Depreciation is the depreciation tax shield; the tax savings that results from the ability
to deduct depreciation. Depreciation expenses have a positive impact on free cash flow.
The third step in capital budgeting is to compute the NPV. To do this we must discount the free cash flow at the
appropriate cost of capital. Cost of capital: the expected return that investors could earn on their best
alternative investment with similar risk and maturity. If cost of capital is given, we compute the present value of
𝐹𝐶𝐹 1
each free cash flow in the future: 𝑃𝑉(𝐹𝐶𝐹𝑡 ) = (1+𝑟)𝑡 𝑡 = 𝐹𝐶𝐹𝑡 ×
⏟
(1+𝑟)𝑡
𝑡−year discount factor
In the calculation of the free cash flow, we include the liquidation value of any assets that are no longer needed
and may be disposed of. When an asset is liquidated, any gain on sale is taxed.
1. Book Value = Purchase Price − Accumulated Depreciation
2. Gain on Sale = Sale Price − Book Value
3. After-Tax Cash Flow from Asset Sale = Sale Price − (𝜏𝐶 × Gain on Sale)
The terminal or continuation value of a project represents the market value (as of the last forecast period) of
the free cash flow from the project at all future dates.
Tax carryforwards → a firm generally identifies its marginal tax rate by determining the tax bracket that it falls
into based on its overall level of pre-tax income. If pre-tax income is negative, then the firm has a net operating
loss (NOL). In that case, no tax is due, and the tax loss carryforward allows corporations to use past NOLs as a
deduction to reduce their taxable income in future years.
Deferred tax asset → the anticipated value of the future tax credits for the firm due to past NOLs that are carried
forward, listed on the balance sheet.
Break-even analysis: we calculate the value at which the NPV of the investment is zero (break-even level).
Sensitivity analysis: breaks the NPV calculation into its component assumptions and shows how the NPV varies
as the underlying assumptions change; allows us to explore the effects of errors in our NPV estimates for the
project.
Scenario analysis: considers the effect on the NPV of changing multiple project parameters.
WEEK 2
A firm’s capital structure: the relative proportions of debt, equity, and other securities that a firm has
outstanding. If capital structure has a role in determining firm value, it must come from changes to the firm’s
cash flows that result from market imperfections.
Perfect capital market: all securities are fairly priced, there are no taxes or transaction costs, and the total cash
flows of the firm’s projects are not affected by how the firm finances them.
Unlevered equity: equity in a firm with no debt. Because there is no debt, the date 1 cash flows of the unlevered
equity are equal to those of the project (no arbitrage).
Levered equity: equity in a firm that also has debt outstanding. Promised payments to debt holders must be
made before any payments to equity holders are distributed.
Leverage increases the risk of the equity of a firm. Therefore, it is inappropriate to discount the cash flows of
leverage equity at the same discount rate that is used for unlevered equity. Investors in levered equity require
a higher expected return to compensate for its increased risk.
The benefits of buying summaries with Stuvia:
Guaranteed quality through customer reviews
Stuvia customers have reviewed more than 700,000 summaries. This how you know that you are buying the best documents.
Quick and easy check-out
You can quickly pay through credit card for the summaries. There is no membership needed.
Focus on what matters
Your fellow students write the study notes themselves, which is why the documents are always reliable and up-to-date. This ensures you quickly get to the core!
Frequently asked questions
What do I get when I buy this document?
You get a PDF, available immediately after your purchase. The purchased document is accessible anytime, anywhere and indefinitely through your profile.
Satisfaction guarantee: how does it work?
Our satisfaction guarantee ensures that you always find a study document that suits you well. You fill out a form, and our customer service team takes care of the rest.
Who am I buying these notes from?
Stuvia is a marketplace, so you are not buying this document from us, but from seller ajakkerman. Stuvia facilitates payment to the seller.
Will I be stuck with a subscription?
No, you only buy these notes for £3.83. You're not tied to anything after your purchase.